The fourier transform is a powerful tool for converting

Assignment Help Applications of MATLAB
Reference no: EM13371627

The Fourier transform is a powerful tool for converting time-series data into its frequency components for the purpose of signal analysis and processing.

Background

In this assignment, you are given a file called "PBF.txt" which is actual pulmonary blood flow data acquired by computed tomography (CT) imaging of porcine animal models. The data was obtained by a 1-second bolus injection of non-iodinated contrast agent into the right ventricle (RV). Due to mixing in the RV, the bolus is "low-pass filtered" and results in a unimodal input function, x(t), measured in the pulmonary artery (PA) using CT imaging.

861_Fourier transform.png

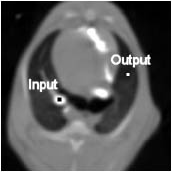
This input function traverses from the PA through various arterial pathways and eventually reaches the lung parenchyma (i.e. microvascular beds within the lung). The extent to which contrast flows to the microvascular beds can also be measured using CT techniques.

Assignment

Download the "PBF.txt" file. In the file, you will find four columns:

(1) time data (unit: seconds),

(2) input function, x(t), measured at the pulmonary artery (unit: Hounsfield Unit (HU)),

(3) output function, y(t), measured in the lung parenchyma (unit: Hounsfield Unit (HU)),

(4) transfer function, h(t), which describes the system which modifies the input from the PA and produces the output seen at the lung parenchyma.

Using Matlab:

  • Plot x(t), y(t), and h(t), each vs. time.
  • In the time domain, descriptively analyze the how the x(t) differs from y(t).
  • Perform a Fourier Transform (Matlab command, fft(x)) of x(t), and y(t). Plot the magnitude (i.e. "abs") of the FFTs of the input (x(t)) and output (y(t)). (Note: Using the FFT function, you will obtain an output that has both real and imaginary components).
  • Determine how many frequencies are needed to adequately (respectively within +1% and +5% error) represent the original time series data (analyze for both x(t) and y(t)).

Hint: (1) You will need to use the IFFT function to perform the "inverse FFT" to go from the frequency domain back to the time domain)

(2) Error= sum(abs(x(t))-abs(x_new(t)))/sum(abs(x(t))) x and x_new are the original time history and new one generated by IFFT

  • Plot the original vs. the "truncated" waveforms that you generate for each.
  • Comment/discuss your observations.
  • Using the transfer function, h(t), convolve your new input function with the transfer function and compare the output with the original output (y(t)) and your new output function. (Hint: Use the CONV command in Matlab. Using CONV, the length of the new data will be twice as long as the original vector. Only plot the first half).

Download:- PBF.txt

Verified Expert

Reference no: EM13371627

Questions Cloud

1 construct an explicit deformation retraction of the torus : 1. construct an explicit deformation retraction of the torus with one point deleted onto a graph consisting of two
Part-11theory of the firmaif in an efficient brewing : part-11.theory of the firmaif in an efficient brewing industry firms operating at lowest possible average cost produce
Assume that capacitor is completely discharged when tlt0 : assume that capacitor is completely discharged when tlt0. plot these graphs in matlab or any other computing software
Course description a development of value and distribution : course description a development of value and distribution theories. detailed analysis of the reactions of consuming
The fourier transform is a powerful tool for converting : the fourier transform is a powerful tool for converting time-series data into its frequency components for the purpose
Task 1 fill out surveyplease take the 122223 survey at : task 1 fill out surveyplease take the 122223 survey at survey.osble.orgindex.php?sid97282. please treat the question
Bt co a beverage manufacturer manufactures one product - : bt co a beverage manufacturer manufactures one product - trublood. bt accounts for its finished goods inventory using
Select any 8 articles of business management services amp : select any 8 articles of business management services amp operation management and risk management. selection of
Assignation individual t5ai 4 variance analysis1tooltime : assignation individual t5ai 4 variance analysis1.tooltime has a standard of 1.5 pounds of materials per unit at 2 per

Reviews

Write a Review

Applications of MATLAB Questions & Answers

  Question 1 consider the images distributed or collected as

question 1 consider the images distributed or collected as a part of your project. develop the equivalent of a low pass

  Problem 1 consider a steel cantilever beam with length of l

problem 1. consider a steel cantilever beam with length of l 18 ft under a distributed random dead load. furthermore

  Create a matrix of 5x6 with identical columns and rows

create a matrix of 5x6. with identical columns and rows ranging from 200 to 1000 in equal

  Nbspd control design

nbspd control design using

  Anbspdesign and explain a computer-based simulation model

anbspdesign and explain a computer-based simulation model which you will use to estimate the probability that among 25

  You are expected to submit properly commented script andor

you are expected to submit properly commented script andor function files that solve the problem stated.nbsp your

  Problem 1 the total transistor count on ic produced over

problem 1 the total transistor count on ic produced over the last 35 years is contained in the file

  1 we want to find the integral of a function at an

1. we want to find the integral of a function at an arbitrary location x from the origin.nbsp thuswhere ix0 is the

  P1 write the commands that will create the following matrix

p1 write the commands that will create the following matrix. you can use only special matrix commandsp2 two cars

  Write a computer program to prepare a linear support vector

write a computer program to prepare a linear support vector machine svm. your program could be able to incorporate and

  Use the three-parameter zone finite element method or the

use the three-parameter zone finite element method or the boundary collocation method to calculate the stress intensity

  Apply specific approach for pattern recognitionimplement

apply specific approach for pattern recognition.implement this approach in matlab.compare and discuss the results with

Free Assignment Quote

Assured A++ Grade

Get guaranteed satisfaction & time on delivery in every assignment order you paid with us! We ensure premium quality solution document along with free turntin report!

All rights reserved! Copyrights ©2019-2020 ExpertsMind IT Educational Pvt Ltd