Reference no: EM132563125
Homework - The Chi-Square Distribution
Question 1: You intend to conduct a goodness-of-fit test for a multinontial distribution with 7 categories. You collect data from 53 subjects.
What are the degrees of freedom for the χ2 distribution for this test? d.f. =
Question 2:
You intend to conduct a test of homogeneity for a contingency table with 4 categories in the column variable and 6 categories in the mw variable. You collect data from 312 subjects.
What are the degrees of freedom for the χ2 distribution for this test? d.f. =
Question 3:
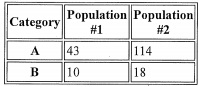
You are conducting a test of homogeneity for the claim that two different populations have the same proportions of the followingao characteristics. Here is the sample data.
Category Population #1 Population #2
A 32 57
B 43 89
What is the chi-square test-statistic for this data? χ2 =
Report all answers accurate to three decimal places.
Question 4:
Both before and after a recent earthquake, surveys were conducted asking voters which of the three candidates they planned on voting for in the upcoming city council election. Has there been a change since the earthquake? Use a level of significance of 0.05. Table shows the results of the survey. Has there been a change in the distribution of voter preferences since the earthquake?
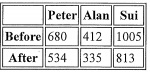
What is the chi-square test-statistic for this data? χ2_
Report all answers accurate to three decimal places.
Question 5:
Do male and female college students have the same distribution of living arrangements? Use a level of significance of 0.05. Suppose that 101 randomly selected male college students and 102 randomly selected female college students were asked about their living arrangements: dormitory, apartment, or other. The results are shown in Table. Do male and female college students have the same distribution of living arrangements?
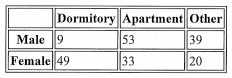
What is the chi-square test-statistic for this data? χ2_____
Report all answers accurate to three decimal places.
Question 6:
You are conducting a multinomial hypothesis test for the claim that the 4 categories occur with the following frequencies:
H0: pA = 0.2 ; pB = 0.3 ; pC = 0.1 ; PD= 0.4
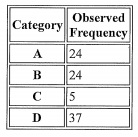
What is the chi-square test-statistic for this data? χ2 =
Report all answers accurate to three decimal places.
Question 7:
You are conducting a test of homogeneity for the claim that two different populations have the same proportions of the following two characteristics. Here is the sample data.
What is the chi-square test-statistic for this data? X2 =
Report all answers accurate to three decimal places.
Question 8:
You are conducting a multinomial hypothesis test (a = 0.05) for the claim that all 5 categories are equally likely to be selected.
Category Observed
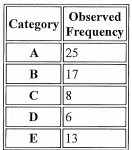
What is the chi-squarc tcst-statistic for this data? χ2 =
What are the degrees of freedom for this test? df =
What is the p-value for this sample? (Report answer accurate to four decimal places.) p-value =
The p-value is...
• less than (or equal to) α
• greater than α
This test statistic leads to a decision to...
reject the null
accept the null
fail to reject the null
accept the altemative
As such, the final conclusion is that...
There is sufficient evidence to warrant rejection of the claim that all 5 categories are equally likely to be selected.
There is not sufficient evidence to warrant rejection of the claim that all 5 categories are equally likely to be selected.
The sample data support the claim that all 5 categories are equally likely to be selected.
There is not sufficient sample evidence to support the claim that all 5 categories are equally likely to be selected.
Question 9:
Employers want to know which days of the week employees arc absent in a five-day work week. Most employers would like to believe that employees are absent equally during the week. Suppose a random sample of 73 managers were asked on which day of the week they had the highest number of employee absences. The results were distributed as in Table. For the population of employees, do the days for the highest number of absences occur with equal frequencies during a five-day work week? Test at a 0.05% significance level.
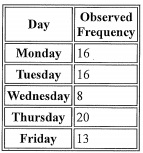
What is the chi-square test-statistic for this data? (Report answer accurate to three decimal places.) χ2=
What are the degrees of freedom for this test? d.f. =
What is the p-value for this sample? (Report answer accurate to four decimal places.) p-value =
The p-value is...
less than (or equal to) α
greater than α
This test statistic leads to a decision to...
reject the null 0 accept the null 0 fail to reject the null
accept the alternative
As such, the final conclusion is that...
There is sufficient evidence to warrant rejection of the claim that all 5 days of the week are equally likely to be selected.
There is not sufficient evidence to warrant rejection of the claim that all 5 days of the week are equally likely to be selected.
The sample data support the claim that all 5 days of the week are equally likely to be selected.
There is not sufficient sample evidence to support the claim that all 5 days of the week are equally likely to be selected.
Question 10:
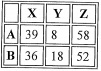
You are conducting a test of the claim that the row variable and the column variable are dependent in the following contingency table.
Give all answers rounded to 3 places after the decimal point, if necessary.
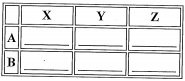
(a) Enter the expected frequencies below:
(b) What is the chi-square test-statistic for this data? Test Statistic: χ2 =
(c) What is the critical value for this test of independence when using a significance level of a = 0.10?
Critical Value: 2 =
(d) What is the correct conclusion of this hypothesis test at the 0.10 significance level?
There is sufficient evidence to warrant rejection of the claim that the row and column variables arc dependent.
There is not sufficient evidence to support the claim that the row and column variables are dependent.
There is sufficient evidence to support the claim that the row and column variables are dependent.
There is not sufficient evidence to warrant rejection of the claim that the row and column variables are dependent.
Remember to give all answers rounded to 3 places after Elie decimal point, if necessary.