Reference no: EM131444680
Question: In this exercise you will estimate the effect of oil prices on macroeconomic activity using monthly data on the Index of Industrial Production (IP) and the monthly measure of Ot described in given Exercise. The data can be found on the textbook Web site www.pearsonhighered.com/stock_watson in the file USMacro_Monthly.
a. Compute the monthly growth rate in IP expressed in percentage points, ip4rowth, = 100 X ln(IPt/IPt-1). What are the mean and standard deviation of ip _growth over the 1952:1-2009:12 sample period?
b. Plot the value of Or Why are so many values of 01 equal to zero? Why aren't some values of Ot negative?
c. Estimate a distributed lag model of ip_growth onto current and 18 lagged values of Ot. What value of the HAC standard truncation parameter in did you choose? Why?
d. Taken as a group, are the coefficients on Ot statistically significantly different from zero?
e. Construct graphs like those in Figure 15.2 showing the estimated dynamic multipliers, cumulative multipliers, and 95% confidence intervals. Comment on the real-world size of the multipliers.
f. Suppose that high demand in the United States (evidenced by large values of ip_growth) leads to increases in oil prices. Is Ot exogenous? Are the estimated multipliers shown in the graphs in (e) reliable? Explain.
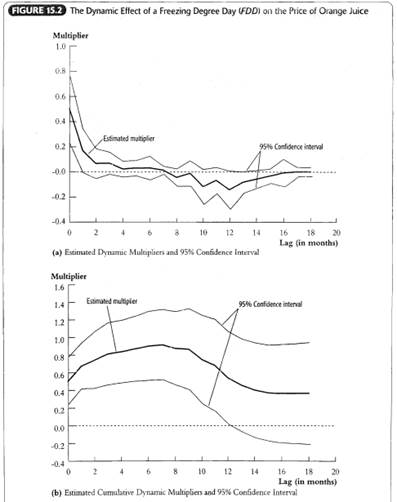
Exercise: Increases in oil prices have been blamed for several recessions in developed countries. To quantify the effect of oil prices on real economic activity. researchers have done regressions like those discussed in this chapter. Let GDPt denote the value of quarterly gross domestic product in the United States and let Yt -= 1001n(GDPt/GDPt-1) be the quarterly percentage change in GDP. James Hamilton, an econometrician and macroeconomist, has suggested that oil prices adversely affect that economy only when they jump above their values in the recent past. Specifically, let Ot equal the greater of zero or the percentage point difference between oil prices at date t and their maximum value during the past year. A distributed lag regression relating Yt and Ot, estimated over 1955:I-2000:IV, is
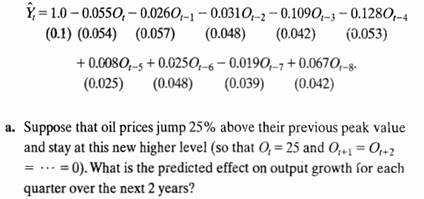
b. Construct a 95% confidence interval for your answers in (a).
c. What is the predicted cumulative change in GDP growth over eight quarters?
d. The HAC F-statistic testing whether the coefficients on Ot and its lags are zero is 3.49. Are the coefficients significantly different from zero?
|
What strategic financial management encompasses
: Organizations can differ on their view of what strategic financial management encompasses. What is an appropriate definition from your point of view (perhaps augmented by some Internet research)? Is your view consistent with usual current practice? D..
|
|
How might your children be different from you
: How are communication technologies altering the human social experience? How might your children be different from you because of the communication technologies which will likely be present when they grow up?
|
|
Purely as financial transaction
: Present value: Your brother has asked you for a loan and has promised to pay you $7,750 at the end of three years. If you normally invest to earn 6 percent per year, how much will you be willing to lend to your brother if you view this purely as a fi..
|
|
Confidence interval for the population mean income
: What is the bound on the error of estimation (or margin of error) for the 95% confidence interval for the population mean income?
|
|
Test the hac f-statistics
: In this exercise you will estimate the effect of oil prices on macroeconomic activity using monthly data on the Index of Industrial Production (IP) and the monthly measure of Ot described in given Exercise.
|
|
Explain the physical characteristics featured in graphic
: Post a description of the two graphics you selected (identify each graphic by number). Use clinical terminologies to explain the physical characteristics featured in each graphic. Formulate a differential diagnosis of three to five possible condit..
|
|
Confidence interval for the population mean income
: What is the bound on the error of estimation ( or margin of error) for the 95% confidence interval for the population mean income?
|
|
Analyze the climate of the time period in terms of political
: You will be researching an historical figure in the public health world, their contribution to public health, and how their work helped shape the public health system. Furthermore, you will be analyzing how their contribution from the past continu..
|
|
Prepare an array of peoples first names
: Create an array of people's first names. Using a loop, read the names from a text (txt) file, and store each one into the array. The array should allow for a maximum of 100 entries.
|