Test the arithmetic lag restrictions given

Assignment Help Econometrics
Reference no: EM131409590

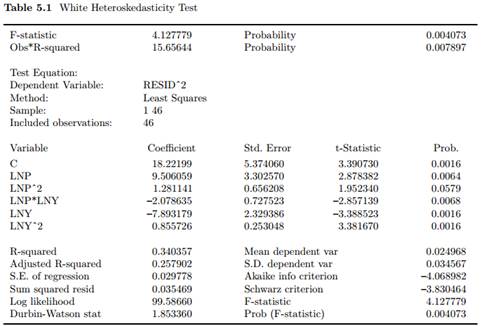
Consider the Consumption-Income data given in Table 5.1 and provided on the Springer web site as CONSUMP.DAT. Estimate a Consumption-Income regression in logs that allows for a six year lag on income as follows:

(a) Use the linear arithmetic lag given in equation (6.2). Show that this result can also be obtained as an Almon lag first-degree polynomial with a far end point constraint.

(b) Use an Almon lag second-degree polynomial, described in equation (6.4), imposing the near end point constraint.

(c) Use an Almon lag second-degree polynomial imposing the far end point constraint.

(d) Use an Almon lag second-degree polynomial imposing both end point constraints.

(e) Using Chow's F-statistic, test the arithmetic lag restrictions given in part (a).

(f) Using Chow's F-statistic, test the Almon lag restrictions implied by the model in part (b).

(g) Repeat part (f) for the restrictions imposed in parts (c) and (d).
222_058b61ad-b1c2-4897-84a7-5f23f4b6f10a.png

Reference no: EM131409590

Questions Cloud

Write and balance the molecular equation : Write and balance the molecular equation and then give ionic and net ionic equations for the neutralization reaction between Ba(OH)2(aq) and HF(aq). Assume the salt formed in this neutralization reaction is insoluble.
Develop an application review matrix : Develop an application review matrix that may help support the installation of a software application at a health care organization.Discuss legislative and regulatory rule changes that may affect the need to implement electronic health applicatio..
What are some of signals for presence of multicollinearity : One of the indicators that multicollinearity is present is when a variable that is known to be an important predictor ends up having a partial regression coefficient that is not significant. What are some of the other signals for the presence of ..
Generate a plot of absorbance : Using the calculation you performed in your Pre-Lab in Microsoft Excel, generate a plot of absorbance @ your chosen wavelength (the wavelength that provides the best data for your purposes) vs. [indicator].
Test the arithmetic lag restrictions given : Use the linear arithmetic lag given in equation (6.2). Show that this result can also be obtained as an Almon lag first-degree polynomial with a far end point constraint.
Explain the key principles of data security : Recommend at least three (3) specific tasks that could be performed to improve the quality of datasets, using the Software.Development Life Cycle (SDLC) methodology. Include a thorough description of each activity per each phase.
Identify all of risks that are associated with your project : For this assignment, you will use what you identified as your approach in this Discussion Board to identify and assess all of the risks that are associated with your project.
Would multicollinearity tend to be a problem : In linear regression models, for what types of uses or applications would multicollinearity tend to be a problem? Are there any applications or uses for which multicollinearity would not be a problem?
Problem regarding the electron configuration : A S atom has an electron configuration of 2.8.6. What is the electron configuration of an S2- ion?

Reviews

Write a Review

Econometrics Questions & Answers

  Determine what is the approximate polish inflation rate

Suppose that the exchange rate between the Polish Zloty and the U.S. dollar is currently 4 Zls to the dollar. The one year forward rate for the Zloty is 4.5 Zls to the dollar

  What is the equation of the demand curve for clothing

A consumer purchases two goods, food (F) and clothing (C). Her utility function is U(F,C) = FC + C; thus, MUf = C and MUc = F + 1. The price of food is Pf , the price of clothing is Pc , and the income of the consumer is I.

  Does your organization have a software reuse process

Do you have any experience in the integration of existing code?

  Estimate the three multiple regression coefficients

Estimate the three multiple regression coefficients. Estimate their standard errors. Obtain R2 and R2-. Estimate 95% confidence intervals for B2 and B3

  What kind of companies form your population

Design a survey of the way that companies use the Web in your area. What kind of companies form your population? How can you select an unbiased sample from these? What data would you want and how would you collect it? What problems might you meet?

  Find tr-tc profit and the elasticity at profit max q and p

Assume a monopolist with the following demand and cost relationships. Q = 400 - 20p TC = 10 + 5q + q2 Calculate the following: Profit max price Profit max quantity TR, TC, Profit, and the elasticity at profit max q and p.

  What is the expected total return for next 3 years

How does the expected total return compare with the required rate of return on the stock? Does this make sense? Explain your answer.

  Why price does not affected quantity demanded

Qt = 2.5 - 0.3 x Pt + 12 x Mt Where Qt represents the quantity of widgets sold per period t, Pt represents the price of widgets during period t, and Mt represents average household income of customers during period t.

  Classify each as quantitative or qualitative

Snow goose feeding trial. Writing in the Journal of Applied Ecology (Vol. 32, 1995), botanists used multiple regression to model the weight change (y) of a baby snow goose subjected to a feeding trial. Three independent variables measured are list..

  What is the optimal level of advertising

Company Y is a monopoly industry. Its contribution margin is estimated at 20% (P-MC)/P = 0.2). From past experience, the owner has determined the following relationship exists between expenditures on advertising and total sales

  At what price will the producer sell this output

At what price will the producer sell this output?

  How will the firm adjust employment if the wage rises

Suppose a firm's short-run total product schedule is given in the table below. It sells its output in a competitive market for $1.50 per unit. Labor Total Product Marginal Product Marginal Revenue Product 0 0 1 8 2 18 3 29 4 39 5 47 6 52 7 53 8 53

Free Assignment Quote

Assured A++ Grade

Get guaranteed satisfaction & time on delivery in every assignment order you paid with us! We ensure premium quality solution document along with free turntin report!

All rights reserved! Copyrights ©2019-2020 ExpertsMind IT Educational Pvt Ltd