Summarize the lengths of the pencils produced by machines

Assignment Help Applied Statistics
Reference no: EM131713524

Assessment: Collaborative Project 

You work for the Quality Assurance Department of a manufacturing company. Your company manufactures pencils. Machine A, Pencil Maker, is set to produce pencils of mean length 190mm with a standard deviation of 0.1mm.  Machine B, Pencil Giant, produces pencils of mean length 190mm with a standard deviation of 0.2mm. Your boss believes that the machines are not producing pencils of correct length. As the Quality Assurance Officer, you must select a sample of pencils, measure the length of each pencil and use the data to determine whether your boss' claim is true. 

(Each group will be given a different dataset to work with for this project)

(a) Identify your population of interest. 

(b) What sampling technique would you use to select the sample for the study? Why? 

(c) Use a frequency table to summarize the lengths of the pencils produced by both machines.

(d) Use the frequency table to estimate the mean and median length of the pencils produced by both machines.

(e) Complete the contingency table below: 

Machine

Exactly 190mm in length

Within 1 standard deviation of 190mm

More than 1 standard deviations of the 190mm

Total

Machine A


Machine B


Total


(f) Use the contingency table to find the probability that a randomly selected pencil from the sample:

(i) is from Machine A and exactly 190mm; 

(ii) is from Machine A, given that it is 190mm;

(iii) is from Machine A or is exactly 190mm.

(g) Test the claim that the mean length of a pencil from Machine A is not 190mm. Use α = 0.10 and assume that the population is normally distributed.

(h) On the basis of your analysis, what would you tell your boss about Machine A?

(i) Another sample of 50 pencils were selected from Machine. The length and diameter of each pencil was measured and the data inputted in EXCEL. A scatter diagram was drawn using EXCEL. See the diagram below.

422_figure.png

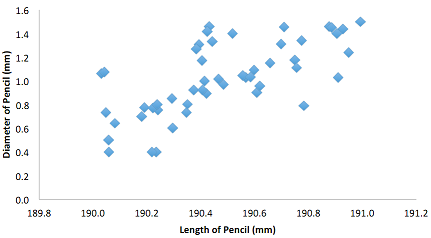
The correlation between the length of the pencil and the diameter of the pencil is 0.67. What does this indicate?

(j) The regression line generated by EXCEL for sample of 50 pencils is  y = 0.7678x - 145.24 where y is the length of the pencil and x is the diameter. What is the expected diameter of a pencil with length 189.7mm?

Attachment:- Data Set.rar

Reference no: EM131713524

Questions Cloud

What fraction of people would be expected : Body temperatures. Most people think that the normal adult body temperature is That figure, based on a 19th-century study, has recently been challenged.
Key elements of these organizational life cycles : What are the key elements of these "organizational life cycles" and how might they affect structure?
Why is diversity and inclusion important to campus culture : Why is a diverse campus important to you? Why is diversity and inclusion important to the campus culture at the University of Toledo?
What is the optimal order quantity : The supplier offers C&A a discount of 5% if the order quantity is 200 or higher. What is the optimal order quantity?
Summarize the lengths of the pencils produced by machines : Assessment: Collaborative Project, Use a frequency table to summarize the lengths of the pencils produced by both machines
Using the new costing system for gaap new income : Is the controller acting ethically by using the new costing system for GAAP new income? Why?
Discuss the implications of human intelligence : Write a one page movie review discussing the implications of human intelligence becoming integrated with software systems, and thus subject to viral attack.
What should be the optimal decision strategy : Draw a decision Tree for Canuck Union Bank. What should be the optimal decision strategy and what is the expected value of this strategy?
Discuss type of manage care hmo, ipa and ppo : What are the similarities and the differences between three type of manage care HMO, IPA and PPO

Reviews

len1713524

11/9/2017 2:38:33 AM

Attached is the assignment and the data set that is to be used for the assignment. Assessment 3: Collaborative Project is the only question that is to be completed. Assessment 3 only! Students are required to conduct a mini-research project so as to apply statistical concept covered throughout the course. Students are expected to work together, in groups of 3 to 5, in a collaborative space, to discuss the questions and prepare the group’s project for submission.

len1713524

11/9/2017 2:38:27 AM

Students are expected to work together throughout the semester on this project. This assignment is to be prepared as a WORD document. The deadline for uploading this Project is 11:55pm EC Time on Friday, 17th. One member of the group is required to upload the project on behalf of the other members. Please ensure that all group members are listed on the cover page of the project. Upload your submission to the appropriate drop box for grading by your etutor.

Write a Review

Applied Statistics Questions & Answers

  Hypothesis testing

What assumptions about the number of pedestrians passing the location in an hour are necessary for your hypothesis test to be valid?

  Calculate the maximum reduction in the standard deviation

Calculate the maximum reduction in the standard deviation

  Calculate the expected value, variance, and standard deviati

Calculate the expected value, variance, and standard deviation of the total income

  Determine the impact of social media use on student learning

Research paper examines determine the impact of social media use on student learning.

  Unemployment survey

Find a statistics study on Unemployment and explain the five-step process of the study.

  Statistical studies

Locate the original poll, summarize the poling procedure (background on how information was gathered), the sample surveyed.

  Evaluate the expected value of the total number of sales

Evaluate the expected value of the total number of sales

  Statistic project

Identify sample, population, sampling frame (if applicable), and response rate (if applicable). Describe sampling technique (if applicable) or experimental design

  Simple data analysis and comparison

Write a report on simple data analysis and comparison.

  Analyze the processed data in statistical survey

Analyze the processed data in Statistical survey.

  What is the probability

Find the probability of given case.

  Frequency distribution

Accepting Manipulation or Manipulating

Free Assignment Quote

Assured A++ Grade

Get guaranteed satisfaction & time on delivery in every assignment order you paid with us! We ensure premium quality solution document along with free turntin report!

All rights reserved! Copyrights ©2019-2020 ExpertsMind IT Educational Pvt Ltd