Steepest ascent-randomized steepest ascent

Assignment Help Engineering Mathematics
Reference no: EM13867635

Problem-1

1.1. Write a program that will find the maxima of the following function using Golden section search algorithm starting from xl = -4 and xu = 1. Your function should take xl , xu, and number of iterations as input parameters. Also plot the graph estimated maxima Vs. iteration number and true error Vs. iteration number.

f(x) = x3 - 10 * x

1.2. Develop a bracketing algorithm to find the maxima of the above function that will generate two random candidate points x1 and x2 with in the bound xl and xu, such that x1 is in the upper half of the bound and x2 is in the lower half of the bound. Then after the algorithm will choose new bounds (xlower and xupper) exactly like in Golden search. Then again two new random candidate points will be generated with in the bound new xl and new xu and the process keeps going till a defined number of iterations.Your function should take xl , xu, and number of iterations as input parameters. Plot the graph estimated maxima Vs. iteration number and true error Vs. iteration number. Also state for this problem was Golden search better or the random bracket search better?

2a. Steepest ascent

Write a Mathematica code to find the maxima of the following multidimensional function using optimal steepest ascent technique. Your function should take the initial starting point and number of iterations as input parameters. Plot the function and the search path on a same graph. [Hint use ContourPlot to plot the function ListLinePlot to draw the search path over the contour]?

f(x, y) = 2xy + 2x - x2 - 2y2

2b. Randomized Steepest ascent

Now repeat the above exercise by moving in the steepest ascent direction with a step size h, which will be user defined. Again plot the function and the search path on a same graph. Which technique you think converges faster to the maxima for this given problem?.

Extra credit

Given a sphere of radius 10 units with 3 particles that interact with each other with in the sphere. The energy of the system for a given configuration of these particles is given by

1190_sphere of radius.jpg

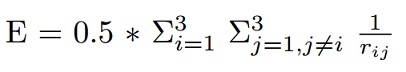
where rij represents the distance between the particles i and j.

Use Mathematica in-built optimization library NMinimize to find out the minimum energy configuration state of this system. Note the particles cannot go outside the sphere neither two particles can occupy the same position with in the sphere. Can you think of a practical application of this simple demonstration.

Reference no: EM13867635

Questions Cloud

Understanding of the methods and techniques : This unit enables learners to develop an understanding of the methods and techniques used to create civil engineering structures and the skills needed to solve problems associated with civil engineering activities
How many employee accumulated less than three thousand miles : How many employees accumulated less than 3,000 miles? Convert the frequency distribution to a cumulative frequency distribution.
Conceptual model for a sales force organization audit : Conceptual Model for a Sales Force Organization Audit
What is the purpose of the system unit : What is the purpose of the system unit? List and define five primary components of the motherboard. List and define the three primary subunits of the CPU
Steepest ascent-randomized steepest ascent : 1.1. Write a program that will find the maxima of the following function using Golden section search algorithm starting from xl = -4 and xu = 1. Your function should take xl , xu, and number of iterations as input parameters. Also plot the graph e..
Analyze your behaviour by constructing a description : Analyze your behaviour by constructing a description of yourself as a consumer - Draw upon your consumption behaviour to describe yourself.
Primary financial investment decision tool of npv : How do sensitivity analysis, scenario analysis, decision tree analysis, and computer simulations assist in making the financial investment decisions? How do these relate to our primary financial investment decision tool of NPV?
Develop a cumulative frequency polygon : Convert the frequency distribution to a cumulative frequency distribution. Develop a cumulative frequency polygon. About 60 percent of the orders were filled in less than how many days?
What should ceo barges invest in before she moves forward : What should CEO Barges invest in before she moves forward to create a plan for change? Explain why she should make this essential investment of time and money

Reviews

Write a Review

Engineering Mathematics Questions & Answers

  Draw a state diagram mealy and check for redundancies

Draw a State Diagram Mealy and check for redundancies and then assign binary State Identifiers.

  The mean low temperature volume based numericals

Give a 95% prediction interval for the mean low temperature volume next month if the high temperature is 50.

  Test of independence states

Question 3: The null hypothesis for the test of independence states that no correlation exists between the variables.

  Data-statistics and decisions in business

You have been recently employed as the director of operations of a hotel. The hotel is in a relatively large city with many other comparable hotels in its vicinity. As part of your job, your responsibilities include:

  Determine the autocorrelation function

1) Determine the autocorrelation function RXX(T) for the continuous-time random process X(t) that has the power spectrum (show all steps for your derivation)

  What is the level of significance

Suppose you are a sociologist in Rock Springs, Wyoming, and a random sample of police files showed that of 38 arrests last month, 26 were of males aged 15 to 34 years. Use a 1% level of significance to test the claim that the population proportion..

  Set up a scatter diagram for speed and miles per gallon

A research analyst for an oil company wants to develop a model to predict miles per gallon based on highway speed.  An experiment is designed in which a test car is driven at speeds ranging from 10 miles per hour to 75 miles per hour.  The results ar..

  Excel and the marketing pricing study data

Utilizing Excel and the Marketing Pricing Study Data (MPS.CSV), create a two-way contingency table of Group Name to Internet Usage (Q18). Conduct a chi-square Test of Independence (use percentages of total option). Answer the following question:

  Volume of a right circular cone

Gravel is being dumped from a conveyor belt at a rate of 30 cubic feet per minute. It form a pile in the shape of a right circular cone whose base diameter and height are always equal. How fast is the height of the pile increasing when the pile is..

  What is the limiting distribution of the markov chain

Determine formulas for the t-step probabilities P(Xt = 0) and P(Xt = 1). What is the limiting distribution of the Markov chain?

  The standard linear regression assumptions issues

What is the residual standard error associated with the regression of alt_cur and CCbest?

  Explain about natural growth model

How long will it take before it is considered dangerous to live in this mountain valley - atmospheric pollutants in a certain mountain valley grown according to a natural growth model

Free Assignment Quote

Assured A++ Grade

Get guaranteed satisfaction & time on delivery in every assignment order you paid with us! We ensure premium quality solution document along with free turntin report!

All rights reserved! Copyrights ©2019-2020 ExpertsMind IT Educational Pvt Ltd