Reference no: EM137659
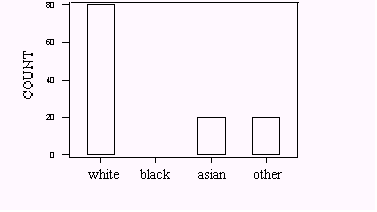
Q. A sample of 160 workers in the downtown area classified each worker by race. A bar graph of the results is given below, but the bar for black workers in the graph below has been omitted.

Using the information provided, the proportion of black workers in the sample must be
A. 40% B. 25% C. 20%
Q. A sample was taken of the salaries of four employees from a large company. The following are their salaries (in thousands of dollars) for this year.
33 31 24 36
The variance of their salaries is
A. 5.1 B. 26 C. 31
Q. In a class of 25 students, 22 students had grades between 71 and 80 (both endpoints included), and three students had grades between 91 and 100 (both endpoints included). For these data,
A. the median must be between 71 and 80.
B. the mean must be between 71 and 80.
C. both answers are correct.
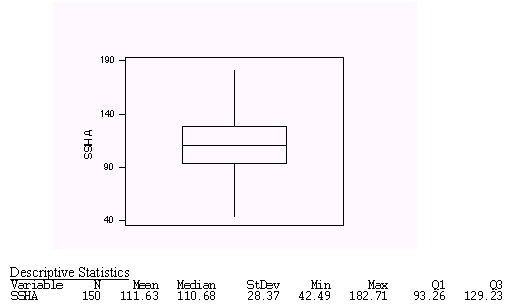
Q. The scores on the Survey of Study Habits and Attitudes (SSHA) for a sample of 150 first-year college women produced the following boxplot and descriptive statistics using MINITAB.

The number of women with scores between 93.26 and 129.23 is
A. about 75. B. about 50. C. about 36.
Q. The time for students to complete a standardized placement exam given to college freshman has a normal distribution with a mean of 62 minutes and a standard deviation of 8 minutes. If students are given one hour to complete the exam, the proportion of students who will complete the exam is about
A. 0.25. B. 0.40. C. 0.60.
|
Find the interquartile range of the salaries
: Suppose each employee in the company receives a $3000 raise for next year (each employee's salary is increased by $3000). The interquartile range of the salaries will
|
|
Suppose we drew a histogram
: Suppose we drew a histogram of these 18 death rates using class intervals 1 — 1.9, 2 — 2.9, 3 — 3.9, 4 — 4.9 and 5 — 5.9. Using the histogram, we would
|
|
Mean of the data represented in this stemplot
: Consider the following stemplot. The mean of the data represented in this stemplot ?
|
|
Find five number summary for the midterm exam
: The student with the 92 found a grading error on her exam and her correct grade was 95. There were no other grading errors. After correcting this student's paper, the five number summary for the midterm exam will be
|
|
Statistics questions
: A sample of 160 workers in the downtown area classified each worker by race. A bar graph of the results is given below, but the bar for black workers in the graph below has been omitted.
|
|
Calculate the price and quantity
: Calculate the price and quantity associated with the perfectly competitive outcome.
|
|
Accomplish this change in the money
: If it wants to accomplish this change in the money supply using open-market operations, what should it do.
|
|
Currencies cause the trade deficit
: Why might variations in the dollar's value in terms of other currencies cause the trade deficit to move independently from the changes in the government budget deficit.
|
|
Changes in parameter values
: Prepare a table with values from all four cases as well as compare the sensitivity of the model solution to changes in parameter values.
|