Reference no: EM132392181
Assignment
Part 1
1. SPC is one of a number of tools which can be used to improve manufacturing quality standards.
(a) Outline two techniques which can be used to decide where to put SPC effort most effectively.
(b) State 3 ways in which the application of SPC can improve quality standards.
(c) State the three basic elements of SPC.
2. From the data given on the next page, produce:
• a tally chart
• a frequency chart
• a ranked frequency chart with cumulative frequencies (work to whole numbers only)
• a Pareto diagram of percentage frequencies and percentage cumulative frequencies (work to whole numbers only).
Data: Record of reasons for rejection of 80 components by 10 types of defects, A to K.
CEECEEKBEC
CCEBKKFKCC
CCEEEEJKJH
EEEECEFCCC
CBBGHFEEBE
AEDEBEBAHC
CKEGHFEEEC
HKEHEECACC.
3.(a) Give examples from your own experience of discrete and continuous variables, and distinguish between the two types.
(b) State the five types of central tendency in general use. Which of these are most frequently used in SPC work?
(c) Calculate the median for the group of results tabulated below:
1, 3, 4, 6, 7, 9, 11, 14, 16, 17, 18.
4. (a) What is the mathematical relationship between variance and standard deviation?
(b) Calculate the range and the arithmetic mean for the following set of data. 4, 8, 16, 20, 28, 32, 38, 44, 48, 54, 60.
3 (c) Supply the missing words in the following statement.
'In very many practical SPC cases approximately ................... of the results recorded will lie within a range defined by the mean plus and minus one standard deviation.'
5. (a) Sketch the Standard Normal Distribution curve.
(b) State the area under this curve from – ∞ to +∞.
(c) With reference to the Standard Normal Distribution curve, what percentage of results lie within the following ranges?
(i) Mean ±1 standard deviation
(ii) Mean ±2 standard deviation
(iii) Mean ±3 standard deviations.
Part 2
1. Describe how to assess the capability of any process to meet its requirements and stay within predefined specification limits.
State the different choices of control chart available and the preferred system used by the process industries.
2. For a given process, the upper specification and lower specification limits are set at 2.549 and 2.503 respectively. If the standard deviation for this process is 0.0036 and the mean is 2.530, calculate the following indices.
(i) Process capability index Cp.
(ii) Process capability index Cpk.
Using your results, make recommendations as to whether this process is capable, and likely to meet its specification requirements. What are the relative advantages of the two types of process capability index?
3. (a) In the event of a process being found to be incapable, what remedial action should be taken to bring it back within specification limits?
State the two types of causes of variations occurring in a process and provide a brief description of each.
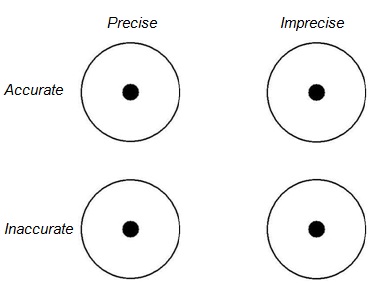
(b) Mark up the diagram opposite, using a pattern of dots in each case, to show the differences between "precise/imprecise" and "accurate/inaccurate" in SPC work.
4. (a) Write an equation defining the Relative Precision Index.
(b) Two sets of components are being made. Inspection sample size is 4.
For set (1), the Total Specification Tolerance is 0.10 mm, and the average range is 0.05 mm.
For set (2), the Total Specification Tolerance is again 0.10 mm but the average range is 0.02 mm.
Calculate the Relative Precision Index in each case and, from the table on the following page, state the relative precision for each group.
|
Sample
Size
|
Value of RPI
|
|
|
Low Relative
Precision
|
Medium Relative
Precision
|
High Relative
Precision
|
|
|
|
2
|
< 6.0
|
6.0 - 7.0
|
> 7.0
|
|
|
3
|
< 4.0
|
4.0 - 5.0
|
> 5.0
|
|
|
4
|
< 3.0
|
3.0 - 4.0
|
> 4.0
|
|
|
5 or 6
|
< 2.5
|
2.5 - 3.5
|
> 3.5
|
|
5. Control chart systems can operate on two basic methods of measurement. State these two methods and briefly distinguish between them, giving three examples of industrial processes where each might be applied. Specify an appropriate sampling procedure in each case.
6. (a) Write a brief note stating the circumstances under which cusum charting may be preferable to normal Shewart charting methods.
(b) Calculate the mean of the sample values below, and suggest a suitable value for k, the cusum reference value.
2.07 2.03 1.99 1.99 2.01 2.00 2.05 2.02
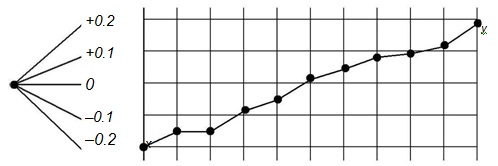
(c) Using the chosen value of k and referring to the cusum chart below, state the process mean between the points x and y.
7. In a manufacturing process, the following data is obtained after examining 10 samples, each of 6 items.
Using this data and the information given below, design and sketch an average control chart, showing upper and lower design limits, upper and lower action limits, and nominal value. Calculate and state the range control limit value.
Nominal size = 12.00 mm, tolerance ± 0.15 mm, Take A′′0.025 = 0.90 and D′0.001 = 2.21.
Sample number 1 2 3 4 5 6 7 8 9 10
Range 0.09 0.08 0.10 0.11 0.12 0.08 0.13 0.08 0.09 0.12
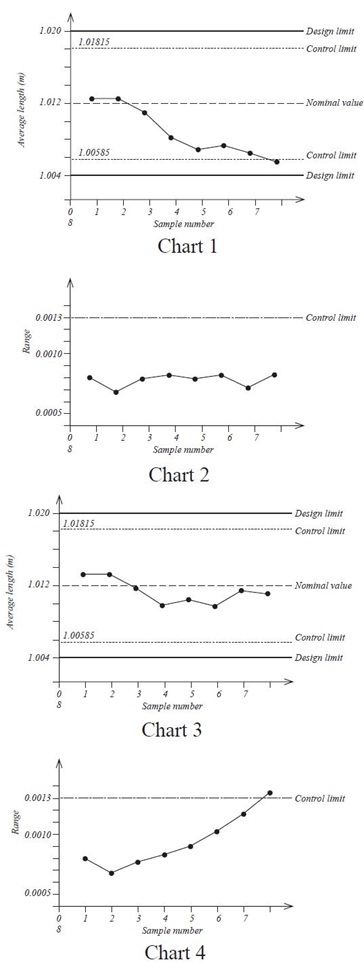
8. Comment on the production control situations depicted by the four control charts shown on the following page, and state what action, if any, would be necessary in each case.