Reference no: EM131162158
1. For each of the scatterplots below answer the following questions:
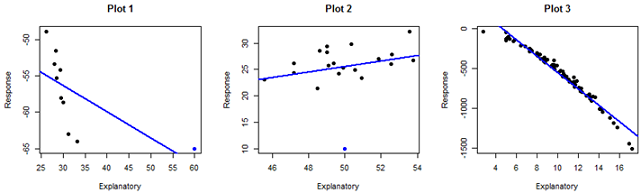
a) For plot 1 there is an extreme point that is marked in blue. Describe this point. It is extreme in the x direction, the y- direction or both? Is it influential and/or will it have a large residual? What would the relationship look like without this point? Do you think the correlation coefficient would get stronger or weaker if this point were removed? Do you think the slope of the LSRL (blue line) would change if this point were removed?
b) For plot 2 there is an extreme point that is marked in blue. Describe this point. It is extreme in the x direction, the y- direction or both? Is it influential and/or will it have a large residual? What would the relationship look like without this point? Do you think the correlation coefficient would get stronger or weaker if this point were removed? Do you think the slope of the LSRL (blue line) would change if this point were removed?
c) For plot 3 describe the relationship between the explanatory and response variable. Is there are strong relationship? Is it positive or negative? Does the relationship seem to be best described by a straight line or does a curved line seem to fit better? What other plot type could we look at to see if the relationship is linear?
2. The data set NFLSeason2015TeamData.csv contains several variables for the football teams in the NFL for the 2015 regular season. These data were obtained from the websites NFL.com and ESPN.com. In this analysis we would like to see the relationship between total points earned in a season and percent of wins for each team. Use the R code and Instructions in Data Analysis 5 tab in Canvas to complete all parts.
a. Make a scatterplot of the relationship between total points earned in a seasonand percent of wins. Use total points earned in a seasonas the explanatory variable. Paste your plot. Describe in context the relationship from the scatterplot. Include strength, direction, form and outliers (if any).
b. Calculate the correlation coefficient r. Describe in context the strength of the relationship based on your value.
c. Using R, calculate the least squares regression line that predicts percent of wins from total points earned in a season. Provide the R output for the model summary. State the least squares regression line (model).
d. From the output, is there evidence that total points earned in a season is a significant predictor of percent wins? Use a significance level of 0.05.
i. State the null and alternative hypothesis for the individual t test on the slope.
ii. State the test statistic and p-value from the output.
iii. Make a conclusion. Include context, a statement in terms of the alternative and the null should be rejected based on the level of significance.
e. Interpret the slope of your model, include a 95% confidence interval for the slope,and interpret.
f. Plot the residuals from the model. Are conditions satisfied? (Normality, Constant Variance, Independence, Linearity). Briefly describe the plot. Include the conditions that need to be met. If conditions don't seem to be met (it's okay!) please state why and which are violated.
g. Provide a scatterplot with a title and the best fit line.
3. Prediction: A common goal in regression is to use the estimated model for prediction.
a. My Favorite NFL team is the Seattle Seahawks. They scored a total of 423 points in the 2015 season. Using your model from 2c, provide percent of season winsprediction for the Seattle Seahawks. Show Work.
b. Seattle won 62.5 percent of their games this last season. How far off is the predicted percent wins from their actual winning percentage? In other words, calculate the residual for Seattle.
c. Calculate the confidence interval for the predicted percent of wins for all teams with 423total points earned in a season. Interpret.
d. Calculate the prediction interval for the predicted percent of wins for the Seattle Seahawks. Interpret.
4. There are most likely several models that could potentially predict percentage of wins for the season. This analysis will look at the model that predicts percent of wins from two explanatory variables total number of touchdowns and total number of field goals made in a season. Below is a partial ANOVA table, use this to answer the following questions.
|
Source
|
Degrees of freedom
|
Sum of Squares
|
Mean Squares
|
F
|
p-val
|
|
Regression
|
2
|
|
|
|
<0.0001
|
|
Residual
|
|
4423.5
|
152.5
|
|
|
|
Total
|
31
|
11250
|
|
|
|
a. Fill out the rest of the ANOVA table based on the provided information.
b. Use the table to calculate the coefficient of determination, R2. Interpret.
c. From the ANOVA table interpret the model utility test (f test). Use a Significance level = 0.05.
- State the Null and Alternative Hypotheses.
- State the F statistic along with the numerator and denominator degrees of freedom and p-value.
- What can you conclude from the test?
d. From the software output state the estimated least squares regression model for
μ_(Y|x_1,x_2,x_3 ) = β_0+ β_1 x_1+β_2 x_2

e. Using this different model predict the percent of wins for the season for the Seattle Seahawks that made 49 touchdowns and 29 field goals during the season.
f. Compare the predictions from 4e and 3a. Which model did a better job at predicting the percent wins for Seattle?