Reference no: EM131003563
PART A
Question 1:
Automobile insurance companies take many factors into consideration when setting rates including the distance travelled each year. In order to determine the effect of gender, a sample of 100 male and 100 female drivers were asked how many kilometres he or she drove in the past year. A frequency distribution and histogram of the distances (in thousands of kilometres) generated by MS Excel ® for the male drivers follows.
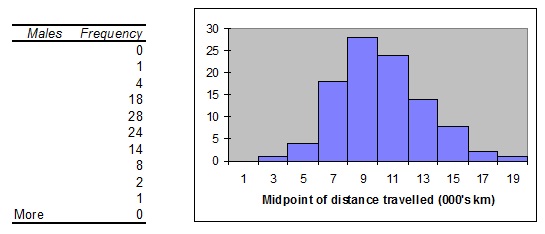
a. Provide appropriate labels for each of the following:
i. the graph title;
ii. the vertical axis.
b. Comment on the shape of the distribution.
c. Copy the frequency distribution table to your exam booklet.
i. Complete the table and insert labels for the appropriate class intervals.
ii. Add an extra column to your frequency distribution prepared above, with the heading ‘relative frequency' and calculate the relative frequencies for these data.
The frequency distribution generated by MS Excel ® for the distances travelled (in thousands of kilometres) by female drivers follows.
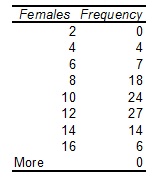
d. Use the statistics functions on your calculator or the formula for grouped data, to find approximations for the mean and standard deviation number of kilometres driven by the sample of 100 female drivers.
e. Why are the values for the mean and standard deviation determined in d. above, only approximations?
The boxplot showing the distribution of the distances travelled (in thousands of kilometres) by female drivers follows.
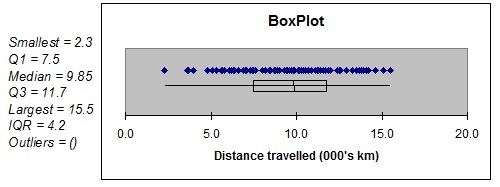
f. What does the boxplot tell you about the distribution of the distances travelled by female drivers? Explain
Question 2:
a. A batch of invoices being audited has 5% of the invoices in error. A sample of 10 invoices is taken at random from the batch. What is the probability that the sample will contain
i. exactly two incorrect invoices?
ii. less than two incorrect invoices?
iii. more than 8 correct invoices?
b. A Professor of statistics has noted from past experience that students who do all their assignments and tutorial questions have a 90% chance of passing the final exam, and if they don't do any of the assignments and tutorial questions they have a 15% chance of passing the final exam. The Professor estimates that 65% of the students do their assignments and tutorial questions.
i. Define each of the simple events and then draw a probability tree to represent the information above.
ii. What percentage of students passed the final exam?
iii. Given that a student passed the final exam, what is the probability they completed their assignments and tutorial questions?
c. The travel time for a truck travelling from Sydney to Brisbane is uniformly distributed between 14.5 hours and 16 hours.
i. What is the probability that the trip will take more than 15 hours?
ii. What is the probability that the trip will take between 14.5 and 15 hours?
iii. What is the probability that the trip will take exactly 15.5 hours?
Question 3:
a. Advertising costs for a 30-second commercial are assumed to be normally distributed with a mean of $20 000 and standard deviation of $3000.
i. What is the probability that a given commercial costs between $19 500 and $22 000 to produce?
ii. What is the probability that the average cost to produce a sample of thirty six commercials exceeds $19 500?
b. A company surveyed television viewers in an effort to estimate the proportion of homes with a video cassette recorder (VCR). A survey of 600 homes found 470 with a VCR.
i. What is the point estimate for the true proportion of homes in the population with a VCR?
ii. What is the 95 percent confidence interval estimate for the proportion of homes with a VCR?
iii. Representatives of the VCR industry claim that the true proportion of homes with a VCR is 0.80. Based on the confidence interval estimate in part ii., do the sample data support or refute this claim? Explain.
iv. Suppose the company wish to have a sampling error of plus or minus 0.1 in estimating the proportion of homes with a VCR at the 95 percent confidence level. What size sample is required?
Hint: Use the point estimate in i. when determining the sample size required.
Question 4:
a. A firewood delivery company claims that on average one of their loads weighs 1 ton. Being sceptical of the amount of firewood received a customer arranged to weigh the next 10 loads delivered to households in his street. The sample mean was found to be 0.95 tons with a standard deviation of 0.09 tons. Perform an appropriate statistical test to determine whether or not the company's claim is correct against the possibility that they actually deliver less than 1 ton on average. Use a significance level of 0.05. Assume that the weight of firewood delivered follows a normal distribution.
b. The following data and scatterplot represent the 1990 values for fuel economy (Kilometres/Litre) and lifetime carbon dioxide (CO2) emitted from 12 cars.
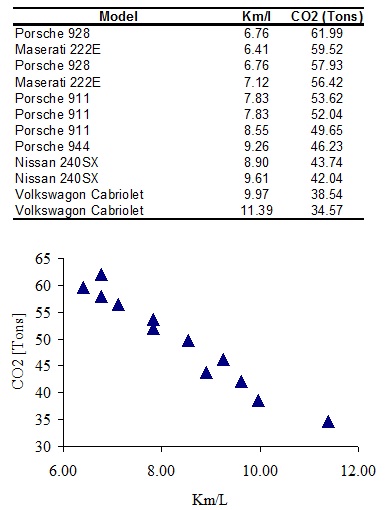
A simple linear regression analysis was performed using MS Excel ® and the following outputs generated;
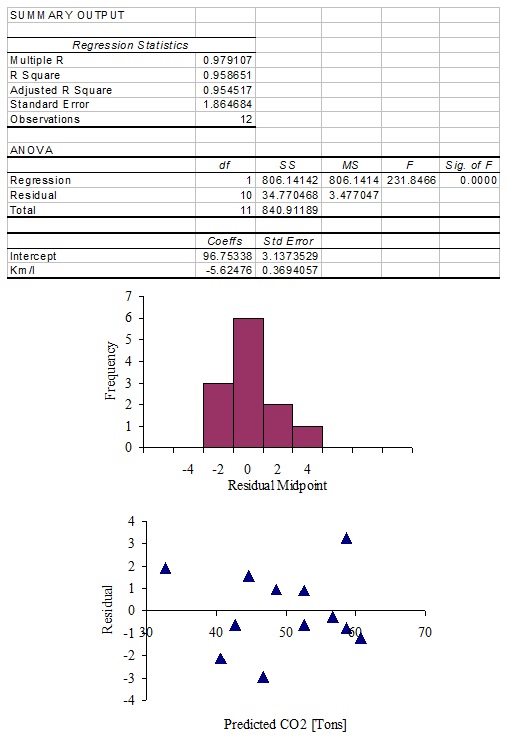
Use the output provided to answer the following questions.
i. Find the correlation coefficient for the relationship between CO2 emissions and fuel economy?
ii. Describe in words the nature of the relationship between CO2 emissions and fuel economy.
iii. Is the relationship between CO2 emissions and fuel economy significant at the 0.05 level? Justify.
iv. Predict the lifetime CO2 emissions for a vehicle with a fuel economy of 8 Km/L
v. Address the assumption of homoscedasticity for the model.
PART B:
1. The mean can be calculated for
A. nominal data
B. ordinal data
C. interval data
D. ratio data
E. both interval and ratio data
2. A stem and leaf display which follows, has been used to sort 44 data values.
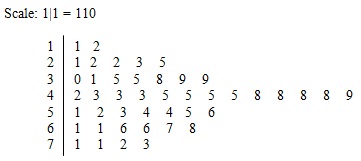
Find the median and the mode for these data.
A. median = 46.5 and mode = 45.
B. median = 48 and mode = 45.
C. median = 450 and mode = 450 and 480.
D. median = 465 and mode = 450.
E. median = 465 and mode = 450 and 480.
Use the following information to answer questions 3. and 4.
Cars are produced on an assembly line. The number of cars requiring extra work after assembly measures the quality of these cars. The number of cars with defects (ie those requiring extra work) for a sample of 12 days follows.
30 34 9 14 28 9 23 0 5 23 7 0
3. The average number of defects per day is
A. 15.1
B. 15.17
C. 11.5
D. 15.16
E. 16
4. The standard deviation number of defects per day is
A. 11.44
B. 11.43
C. 11.94
D. 11.95
E. 8.5
5. The performance of students from two colleges A and B, are to be compared. The mean and standard deviation for the marks on a common test are shown below:
College A College B
Mean mark 50 70
Standard deviation 5 6
Which of the following statements is correct?
A. Students from college A performed better on the average than the students from college B.
B. All the students from college B performed better than the students from college A.
C. All the students from college A performed better than the students from college B.
D. The marks of students from college A are relatively more variable than those of the students from college B.
E. The marks of students from college B are relatively more variable than those of the students from college A.
6. If two events A and B are independent of each other, then equals
A. 0
B. P(A)
C. 1
D. P(A and B)
E. P(B)
7. Given that z is the standard normal variable, find P(0.7 < z < 2.7)
A. 2
B. 0.2385
C. 0.7545
D. 0.7615
E. 0.4772
8. Given that z is the standard normal variable, find α if P(z > α) = 0.7054
A. 0.54
B. -0.54
C. 0.2611
D. -0.2611
E. Can't be determined because 0.7054 is greater than 0.5.
Use the following information to answer questions 9. and 10.
The average number of cars entering a roundabout, is 5 cars per minute. Cars arrive randomly and independently.
9. What is the probability that six or more cars will arrive at the roundabout in the next minute.
A. 0.762
B. 0.616
C. 0.238
D. 0.384
E. 0.146
10. What is the probability that six or more cars will arrive at the roundabout in the next 3 minutes.
A. 0.008
B. 1.152
C. 0.003
D. 0.992
E. 0.997
11. The normal distribution provides a good approximation to the binomial and may be used for interval estimation of a population proportion when
A. n > 30
B. npˆ and nqˆ are both ≥ 5
C. either npˆ or nqˆis ≥ 5
D. np and nq are both ≥ 5
E. either np or nq is 5
12. A stationery store owner would like to estimate the average retail value of greeting cards that it has in its inventory. A random sample of 20 greeting cards indicated a mean value of $2.70 and a standard deviation of $0.35. If greeting card prices are normally distributed, a 95% confidence interval estimate of the population mean value of all greeting cards that are in its inventory would be calculated by
A. $2.70 ± 2.093 x $0.35
B. $2.70 ± (1.96) ($0.35/√20)
C. $2.70 ± (1.729) ($0.35/√20)
D. $2.70 ± (2.086) ($0.35/√20)
E. $2.70 ± (2.093) ($0.35/√20)
13. A Type II error is made when
A. the null hypothesis is not rejected when it is false.
B. the null hypothesis is rejected when it is true.
C. the alternate hypothesis is accepted when it is false.
D. the null hypothesis is accepted when it is true.
E. the alternate hypothesis is accepted when it is true.
14. A hypothesis test returns a p value of 0.15. The null hypothesis should be
A. rejected at the 0.05 level.
B. rejected at the 0.01 level.
C. rejected at the 0.10 level.
D. accepted at the 0.05 level.
E. none of the above.
15. A teller at a branch of a savings bank located in a rural community has averaged 300 transactions daily over the past year. A random sample of 20 days during this year indicates a mean of 295.6 transactions with a standard deviation of 21.9. The appropriate set of hypotheses to test whether the population mean daily transactions has decreased is
A. Ho : μ = 300 HA : μ ≠ 300
B. Ho : μ = 295.6 HA : μ < 295.6
C. Ho : μ > 300 HA : μ < 300
D. Ho : μ ≤ 300 HA : μ > 300
E. Ho : μ = 300 HA : μ < 300
16. If x‾ is the mean of a random sample taken from a population which is normally distributed, the sampling distribution of x‾
A. is also normally distributed, provided the sample size is large relative to the population.
B. is also normally distributed, provided the sample size is small relative to the population.
C. is also normally distributed, regardless of the sample size.
D. can be highly skewed to the right or the left.
E. is unable to be determined from the information given.
17. Which of the following values of Pearson's correlation coefficient indicates the weakest relationship?
A. 0
B. 0.8
C. -0.9
D. 0.1
E. -0.3
18. If the aim of a study is to predict a continuous random variable y from an independent continuous random variable x, an appropriate analysis would be
A. correlation analysis.
B. time series analysis.
C. regression analysis.
D. all of the above .
E. none of the above.
19. In regression analysis a coefficient of determination of 1 means that
A. there is no unexplained variation.
B. there is a large proportion of unexplained variation.
C. there is a small proportion of unexplained variation.
D. as x increases, so does y.
E. as x decreases, so does y.
20. The residuals formed when a regression line is fitted to a data set should ideally
A. be normally distributed.
B. have an expected value of zero.
C. have constant variance.
D. be independent from each other
E. possess all the characteristics of A., B., C. and D.