Reference no: EM132463329
Assignment - Direction Fields
Question 1 - The slope field for a population P modeled by dP/dt = 3P - 3P2 is shown in the figure below.
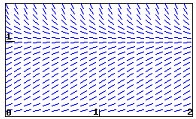
(a) On a print-out of the slope field, sketch three non-zero solution curves showing different types of behavior for the population P. Give an initial condition that will produce each:
P(0) = _________,
P(0) = _________, and
P(0) = _________.
(b) Is there a stable value of the population? If so, give the value; if not, enter none:
Stable value = _________
(c) Considering the shape of solutions for the population, give any intervals for which the following are true. If no such interval exists, enter none, and if there are multiple intervals, give them as a list. (Thus, if solutions are increasing when P is between 1 and 3, enter (1, 3) for that answer; if they are decreasing when P is between 1 and 2 or between 3 and 4, enter (1, 2), (3, 4). Note that your answers may reflect the fact that P is a population.)
P is increasing when P is in_________
P is decreasing when P is in_________
Think about what these conditions mean for the population, and be sure that you are able to explain that.
In the long-run, what is the most likely outcome for the population?
P → _________ (Enter infinity if the population grows without bound.)
Are there any inflection points in the solutions for the population? If so, give them as a comma-separated list (e.g., 1, 3); if not, enter none.
Inflection points are at P =_________
Be sure you can explain what the meaning of the inflection points is for the population.
(d) Sketch a graph of dP/dt against P. Use your graph to answer the following questions.
When is dP/dt positive?
When P is in_________
When is dP/dt negative?
When P is in_________
(Give your answers as intervals or a list of intervals.)
When is dP/dt zero?
When P =_________
(If there is more than one answer, give a list of answers, e.g., 1,2.)
When is dP/dt at a maximum?
When P =_________
Be sure that you can see how the shape of your graph of dP/dt explains the shape of solution curves to the differential equation.
Question 2 - Consider the two slope fields shown, in figures 1 and 2 below.
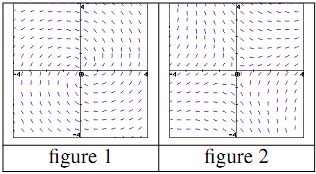
On a print-out of these slope fields, sketch for each three solution curves to the differential equations that generated them.
Then complete the following statements:
For the slope field in figure 1, a solution passing through the point (3, -1) has a
- ?
- positive
- negative
- zero
- undefined
slope.
For the slope field in figure 1, a solution passing through the point (-2, -3) has a
- ?
- positive
- negative
- zero
- undefined
slope.
For the slope field in figure 2, a solution passing through the point (3, 2) has a
- ?
- positive
- negative
- zero
- undefined
slope.
For the slope field in figure 2, a solution passing through the point (0, -4) has a
- ?
- positive
- negative
- zero
- undefined
slope.
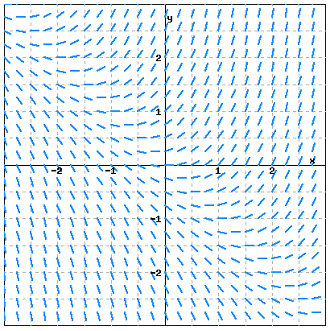
Question 3 - Consider the slope field shown.
(a) For the solution that satisfies y(0) = 0, sketch the solution curve and estimate the following:
y(1) ≈ ____ and y(1) ≈ ____
(b) For the solution that satisfies y(0) = 1, sketch the solution curve and estimate the following:
y(0.5) ≈ ____ and y(1) ≈ ____
(c) For the solution that satisfies y(0) = 1, sketch the solution curve and estimate the following:
y(1) ≈ ____ and y(1) ≈ ____
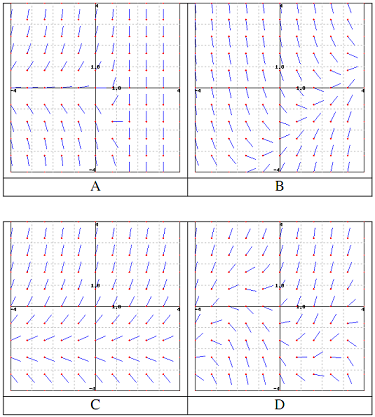
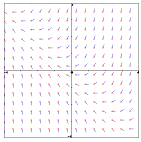
Question 4 - Match the following equations with their direction field. Clicking on each picture will give you an enlarged view. While you can probably solve this problem by guessing, it is useful to try to predict characteristics of the direction field and then match them to the picture. Here are some handy characteristics to start with - you will develop more as you practice.
A. Set y equal to zero and look at how the derivative behaves along the x-axis.
B. Do the same for the y-axis by setting x equal to 0.
C. Consider the curve in the plane defined by setting y' = 0 - this should correspond to the points in the picture where the slope is zero.
D. Setting y' equal to a constant other than zero gives the curve of points where the slope is that constant. These are called isoclines, and can be used to construct the direction field picture by hand.
__1. y'= y + 2
__2. y' = 2y + x2e2x
__3. y' = -2 + x - y
__4. y' = 2sin(x) + 1 + y
Question 5 - Which of the following is a solution curve to the differential equation dy/dx = f(x, y) whose slope field is graphed below?
A. tan-1(x)
B. tan(x)
C. 1 - x + x2
D. - 1 - x - ex