Reference no: EM133373667
Simulation Principles
PROBLEM 1: GRAPHICAL INTEGRATION
You will recall from lecture that the net flow into a stock will determine the behaviour of the stock. While it may seem an easy task to understand the behaviour of a stock from its flows, much research suggests that even those with advanced technical degrees can have trouble with casually performing this task. This problem will give you some experience with stock and flow reasoning.
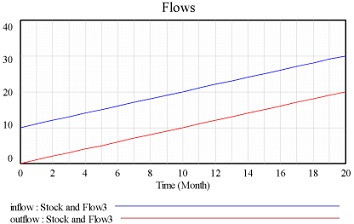
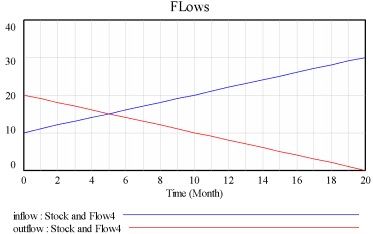
Subproblems a), b) and c) each depict a different scenario, in which the values of the single inflow (blue) and outflow (red) are as given. For each scenario, we describe or depict the inflow into, and the outflow from, the stock over some period of time. For the sake of this question, you may consider the stock as being associated with units Dollars, and that the unit of time is Months; the timeframe given -- as shown in the diagrams -- is 20 months. For each of the scenarios a), b) and c), the text for each scenario specifies the initial value to assume of the stock.
For each of these scenarios, please draw how the stock would behave in response to these flows over that same time period -- i.e., please draw the value of the stock over the period of time given. Please note that you can assume that the value of a stock considered can legitimately hold negative values (i.e., the value of the stock is not restricted to values 0 and higher).
Please note that in pursuing this problem, you can either hand-draw the solution, use a drawing program to do so, or use software calculating the solution. If you wanted to do the latter, you could use a spreadsheet, or could AnyLogic with a stock with an inflow and an outflow whose values are each set using the value returned by a call to a corresponding "Table function" (which can be dragged in from the "Agent" palette), where each of the table functions are passed the current value of time which can be obtained by calling time()). Any of these options for completing the problem are fine, and students are absolutely welcome to think through the problem in their heads.
a) Stock with an initial value of 0 Dollars.
b) Stock with an initial value of 20 Dollars
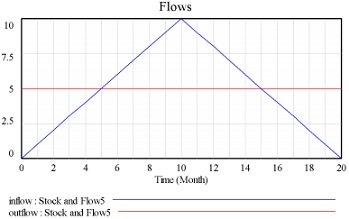
c) Stock with an initial value of 20 Dollars.
PROBLEM 2: AGGREGATE INFECTION TRANSMISSION MODELING
Using AnyLogic, create a classic SEIRS System Dynamics model of infection transmission over a fixed population of size 1000, with β=0.05, c=12.5 per day, a mean time in a state of latent infection (i.e., in the "exposed" state -- infected, but not infective) of 4 days, a mean time before recovery of 8 days, and a mean time to lose immunity of 45 days (similar to what might be imagined for chlamydia or gonorrhea). Exactly 1 person should start infective (i.e., the initial value of I is 1); all other people start in the S stock. The simulation time horizon employed should go from time 0 to time 1000. Using this model, please perform the listed tasks, looking for each at two outcomes: The prevalence of infection in the population (i.e., the fraction of the population that is infective), and the cumulative fraction of the population that has ever been infected. Please note that the "cumulative fraction that has ever been infected" means the fraction of the population that has been infected at any point in time, whether now or earlier. (To address this, it should be emphasized that you are not limited to only 3 stocks for this model; you can include other stocks besides those for the S, I and R compartments).
A. Simulate a baseline scenario, and hand in the results for each of the two outcomes using pictures of the resulting outputs (using AnyLogic TimePlots of the respective model variables)
B. Imagine a situation where, in anticipation of the impending outbreak, there is an aggressive campaign to promote good hygiene through handwashing and other measures. To understand the impact, simulate a "hygienic intervention" scenario
where the value of β is half of its baseline value. Please report the same outcomes as for the baseline scenario above (submitting the images of the time TimePlots).
C. Imagine a situation where to lower outbreak burden, schools have been shut, and some business have allowed employees to work from home or to go on leave. Simulate a "social distancing intervention" scenario where the value of c is half of its baseline value. All other parameters should be set per their baseline values.
a. Please report the same outcomes as for the baseline scenario above (submitting the images of the time TimePlots).
b. Comment on how this compares to the results of the hygienic intervention seen above, and provide an explanation as to why you see this result.
D. Now please simulate a situation where both of the above interventions occur simultaneously. As above, all other parameters should be set per their baseline values.
a. Please report the same outcomes as for the baseline scenario above (submitting the images of the time TimePlots).
b. Comment on how this compares to the results of each of the interventions seen above, and provide an explanation as to why you see such differences
E. Please hand in your model from the above.
PROBLEM 3: ADDING HEALTH SERVICES
The model that you created in the previous problem depicts a situation in which an individual who has recovered from infection can get infected arbitrarily many times, on account of the fact that immunity wanes. This problem explores an extension to this model that will incorporate additional structure.
A. Please try to add a "Hospitalized" stock, with the idea that a certain fraction (5%) of all infections require the infected person to be hospitalized upon the completion of their latent stage (a stage represented by the "Exposed" stock in the model). For simplicity, you can assume that when a person becomes a patient in the hospital, enough safety precautions are undertaken that this patient poses no risk of transmitting to other people whilst in the hospital. You can further assume that this person will stay in the hospital for a mean time of 14 days, after which they transition to the "Recovered" stock. Finally, given that this stock represents people hospitalized for this condition, this stock starts with an initial value of 0.
B. Please further add a "CumulativeHospitalized" stock, which characterizes, for a given time, the count of all people hospitalized by the infection at any point during the simulations, from the start of the model to the current time. This stock also starts with an initial value of 0.
C. Simulate a baseline scenario, and hand in the results using pictures of both the original outputs, the count of people currently hospitalized, and the cumulative count of people hospitalized since the model start, each displayed using AnyLogic TimePlots of the respective model variables.
D. Please run each of the scenarios involved in the previous problem, taking images of all four of the outputs that you considered above for the baseline.
E. How do the intervention measures affect cumulative hospitalizations by the final time of the model?
F. Please hand in your model from the above.
PROBLEM 4: ORDINARY DIFFERENTIAL EQUATION REPRESENTATION OF A MODEL AND BASIC REPRODUCTIVE NUMBER FOR A MODEL
Recall that in class we discussed the classic "Kermack-McKendrick" SIR model. This model is equipped with a structure depicted here:
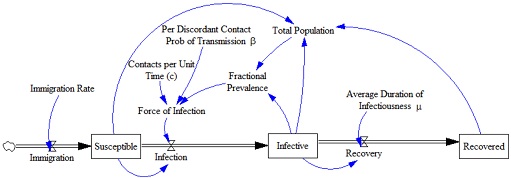
As a reminder, the ordinary differential equations associated with the SIR model are as follows:
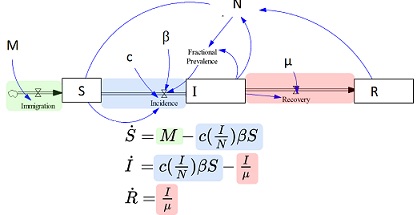
Within class, we further introduced the concept of the basic reproductive number, noting that it represented the mean count of infections transmitted by an index susceptible over the full course of their illness, in an otherwise susceptible population. For the SIR model above (specifically), we further noted that the basic reproductive number was given as cβμ, and walked through the reasoning behind that formula.
Recall further that in problem 3 above, you built an SEIRS model. As described above,
this SEIRS model depicts a situation in which an individual who is infected spends time in a state of "latent infection" following infection, during which time they are infected but not yet infectious (infective). This model also depicts a situation in which an individual recovered from infectiousness can get infected arbitrarily many times, on account of the fact that immunity wanes.
A. Above, you were reminded of the ordinary differential equations associated with the SIR model. Please write down and hand in the ordinary differential equations associated with the SEIRS model. Please note that in writing these down, you need not use the specially formatted math notation noted above; for example, if you wish you can denote the time derivative of S as dS/dt, rather than as , and can write I/μ as I/mu.
B. Above, you were reminded of the basic reproductive number of the SIR model.
Please give here a formula for the basic reproductive number of this model?
Note: Use ANYLOGIC software