Reference no: EM13853763
Question 1: Simulating From The Sampling Distribution and Hypothesis Testing
A disease simulator can be found at the following link: https://www.learner.org/courses/envsci/interactives/disease/disease.html
The simulator models the spread of a disease across a population over the course of 100 days. We will be using this application to simulate an outbreak of Ebola in a high density region. According to research Ebola has a transmission rate of 15% and is fatal for 60% those infected. Assume that those infected with the Ebola virus will be contagious for 25 days. Set these to be the parameter values under the details tab of the application. Also set the population density to be High and the population mixing to Medium.
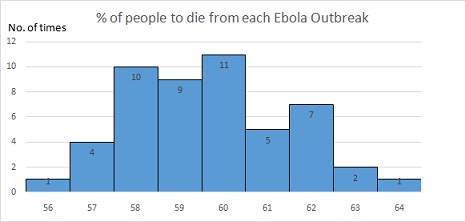
1. Run the simulation 50 times and record the proportions of people that die from each outbreak. Generate a histogram of your data and compute the four quantities that correspond to the histogram's shape characteristics.
|
Population: 900
|
|
Outbreak
|
Number of people that die for Ebola
|
% of deaths
|
|
1
|
504
|
56
|
|
2
|
515
|
57.2
|
|
3
|
515
|
57.2
|
|
4
|
518
|
57.6
|
|
5
|
519
|
57.7
|
|
6
|
522
|
58
|
|
7
|
523
|
58.1
|
|
8
|
524
|
58.2
|
|
9
|
526
|
58.4
|
|
10
|
528
|
58.7
|
|
11
|
528
|
58.7
|
|
12
|
528
|
58.7
|
|
13
|
528
|
58.7
|
|
14
|
529
|
58.8
|
|
15
|
529
|
58.8
|
|
16
|
532
|
59.1
|
|
17
|
533
|
59.2
|
|
18
|
533
|
59.2
|
|
19
|
534
|
59.3
|
|
20
|
536
|
59.6
|
|
21
|
536
|
59.6
|
|
22
|
537
|
59.7
|
|
23
|
539
|
59.9
|
|
24
|
539
|
59.9
|
|
25
|
541
|
60.1
|
|
26
|
542
|
60.2
|
|
27
|
542
|
60.2
|
|
28
|
543
|
60.3
|
|
29
|
543
|
60.3
|
|
30
|
544
|
60.4
|
|
31
|
545
|
60.6
|
|
32
|
545
|
60.6
|
|
33
|
546
|
60.7
|
|
34
|
546
|
60.7
|
|
35
|
548
|
60.9
|
|
36
|
550
|
61.1
|
|
37
|
550
|
61.1
|
|
38
|
551
|
61.2
|
|
39
|
553
|
61.4
|
|
40
|
554
|
61.6
|
|
41
|
559
|
62.1
|
|
42
|
559
|
62.1
|
|
43
|
559
|
62.1
|
|
44
|
562
|
62.4
|
|
45
|
566
|
62.9
|
|
46
|
566
|
62.9
|
|
47
|
566
|
62.9
|
|
48
|
567
|
63
|
|
49
|
571
|
63.4
|
|
50
|
578
|
64.2
|
Sturge's Formula (Class Intervals) = 1+3.3LOG10(50)
= 6.606601014
»7
Class Width = (Max-Min)/Class Interval
= (64.2-56)/7
»1.17
» 1
|
Descriptive Statistics
|
|
Mean
|
60.114
|
|
Standard Error
|
0.25704776
|
|
Median
|
60.15
|
|
Mode
|
58.7
|
|
Standard Deviation
|
1.817602143
|
|
Sample Variance
|
3.303677551
|
|
Kurtosis
|
-0.404838561
|
|
Skewness
|
0.140767785
|
|
Range
|
8.2
|
|
Minimum
|
56
|
|
Maximum
|
64.2
|
|
Sum
|
3005.7
|
|
Count
|
50
|
|
Empirical Rule
|
|
|
|
|
|
mean +/- 1 S.D.
|
58.29639786
|
61.93160214
|
32
|
64%
|
|
mean +/- 2 S.D.
|
56.47879571
|
63.74920429
|
48
|
96%
|
|
mean +/- 3 S.D.
|
54.66119357
|
65.56680643
|
50
|
100%
|
The histogram has a relatively bell shaped curve.The mean and median of the distribution of the proportion of deaths are approximately the same as the histogram depicts the shape of the distribution as approximately symmetric. With a standard deviation of 1.82, it means that data spread is close to the mean this corresponds to the histogram where most of the results are seen clustered around the mean. The skewness is 0.14 and kurtosis is -0.40 which both are very close to 0 indicates that it has a normal and mesokurtic distribution. Since the curve is approximately bell shaped, meaning that the proportion of deaths has approximately a normal distribution.There are also no outliers in the above histogram.
1. If you were able to observe an infinite number of samples (i.e. run the simulation an infinite number of times), what shape would you expect your histogram of the proportion of deaths to look like? Please frame your answer in terms of the four fundamental shape characteristics and make sure to provide your reasoning.
If an infinite number of samples were to be observed, the shape of the histogram of the proportion of deaths will become more symmetric and bell shaped. Since the sample data of 50 outbreaks indicated that the distribution of the proportion of deaths is approximately symmetric and bell shaped, for infinite number of samples this will stabilize to become perfectly symmetric and bell-shaped.
2. Some news agencies have reported that Ebola kills 65% of those infected. If this were true, what would be the sampling distribution of the estimator ˆp of the proportion of people that die from an Ebola outbreak?
p^: X/n=0.65=65%
3. A researcher from the World Health Organization informs you that the proportion reported in the news is too high, that instead the true proportion of people that would die from an Ebola outbreak is 60%. You need to decide who to believe. Outline your problem in terms of the hypothesis testing framework and provide a corresponding visual depiction. Make sure to correctly label all the items in your diagram and clearly state any assumptions you are making.
Step 1:
H0: p = 0.60
HA: p = 0.65
Step 2:
Use Z = (p^-p)/Ö(p^*q-hat) as testing a single population proportion p (uses standard normal)
Step 3:
Testing at a significance level of 5% (a = 0.05)
Step 4:
Reject H0if z > z0.05 = 1.645
Step 5:
4. In deciding between these two states of the world, you utilize a sample of 900 observations and set the probability of making a Type II error to be 5%. Compute the critical value associated with this probability and provide a corresponding visual depiction. Make sure to correctly label all the items in your diagram and clearly state any assumptions you are making.
The Type II error is (when H0: p=0.60): fail to reject the null when it is false. Using the wrong proportion (60%) of people that would die from Ebola when 65% is true.
Critical Value: Z0.05 = 1.645
Standardize: ?