Simulate the standardised sum of independent

Assignment Help Simulation in MATLAB
Reference no: EM13291763

1. Repeatedly (104 times) simulate the standardised sum of independent and identically distributed variates X1, . . . ,Xn

648_standard normal density curve.png

and provide histogram plots, with the (suitably renormalised) standard normal density curve superimposed, for

(a) X1 ~ Exp(1) and n = 2, 6, 1000.
(b) X1 ~ Ber(3=4) and n = 5, 20, 100.

Supply your code.

2. Repeat the simulation in Q1a with n = 1000, and independently simulate an equal number of outcomes from the standard normal distribution using the Box- Muller method. Plot the empirical quantiles against eachother, together with the line y = x, and comment on the plausibility that the samples come from the same distribution. Supply your code.

3. Simulate 106 outcomes (X, Y ), where

948_standard normal density curve1.png

with Θ ~ [0, 2Π), and R = 5 + S with S ~ Exp(1) independently of Θ. Provide a scatter plot of typical output, and give the (empirical) correlation. Comment on the correlation and dependence of (X, Y ). Supply your code.

4. Simulate 200 coin-flip experiments with success parameter p = 1=4, and compute the average number of successes p, together with an approximate 95% conβdence interval

775_standard normal density curve2.png

where zq is the q-th quantile of a standard normal variate. Repeat the experiment 104 times, and plot the approximate conβdence intervals for each experiment, together with a line showing the true success parameter. Calculate the proportion of the 104 repeated experiments that contain the true success parameter, and comment. Supply your code.

5. Simulate N = 103 outcomes from the model

Y = -2 + X + ε

where X ~ U[0, 1] and ε ~ N(0, 0.12 ) independently. From your simulated outcomes of (X, Y ), βt a linear regression model to increasing numbers of outcomes (from N = 2 to N = 104 ) as

y = β0 + β1x

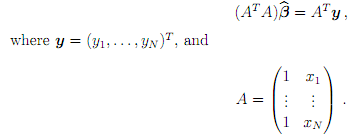
by using the solution to the normal equations to obtain estimates for 1715_standard normal density curve3.png, via solving where

1395_standard normal density curve4.png

Plot your estimates for β0 and β1 as N increases, together with a line indicating their true values. Supply your code.

6. Simulate N = 104 outcomes from the model

where X ~ U[0, 1] and ε ~ N(0, 0.1 ) independently. From your simulated outcomes of (X, Y ).

(a) Fit a linear regression model as in Q5, and plot your estimates for β0 and β1 as N increases, together with a line indicating their true values. Supply your code.

(b) Fit a quadratic regression model y = β0 + β1x+ β2x2, and plot your estimates for β0, β1, and β2 as N increases, together with a line indicating their true values. Supply your code.

Reference no: EM13291763

Questions Cloud

In what direction do the poles of the compasses point : a conductor is connected to a battery and placed between two compasses. An electric current is then passed through the conductor. In what direction do the poles of the compasses point.
Determine the location of the object from the source : Ultrasound intensity level: Beta = 10Log (I2/I1), I1 and I2 = intensity at different locations/times An ultra sound signal is sent under sea water (v=1530m/s) to detect the location of an object. Determine the location of the object from the source
Find how far from the base of the table : A marble moving 1.48 m/s rolls off the top edge of a 125. cm high table. How far from the base of the table did it strike the floor
What is the current in inductor for the steady state current : After the third time constant, what is the current in an inductor if the steady state circuit current is 10 amps
Simulate the standardised sum of independent : Simulate the standardised sum of independent and identically distributed variates - Fit a linear regression model as in Q5, and plot your estimates for β0 and β1 as N increases, together with a line indicating their true values. Supply your code.
Find the sum of these two vectors in terms of magnitude : Vector A is 5.5 cm long and points along the x axis. Vector B is 7.5 cm long and points at +30° above the negative x axis. Determine the sum of these two vectors in terms of magnitude and direction
How much voltage wouldbe present across the capacitor : If an RC circuit is supplied with 24 VDC and the circuit is in its third time constant, how much voltage wouldbe present across the capacitor
Explain what is the pressure in atmospheres : Manometers can use liquids other than mercury to measure small pressure differences. On a day when the barometric pressure is 764.3 torr, a water manometer, connected between the atmosphere and a glass bulb
How far was the laser originally from the object : Measuring distances to high precision is a critical goal in engineering. Numerous devices to exist to perform such measurements, with many involving laser light. How far was the laser originally from the object

Reviews

Write a Review

Simulation in MATLAB Questions & Answers

  Calculate the stress intensity factor

Use the three-parameter zone finite element method or the boundary collocation method to calculate the stress intensity factor K, at the crack tip for the plate

  Build a simulation using newtons laws of motion

Build a new and different simulation of your own using Newtons laws of motion and Show the code and describe how it works

  Write the specification of load mover

Write the specification of LOAD MOVER detailed of the whole design and precise for automatic control section and divide the design into various modules and Is the kernel required if yes which one?

  Design the automatic control section using statecharts

Aim of this project is to design an embedded system which can move loads from one place to another. The system can be operated manually, automatically and wirelessly.

  Need an expert who can model a drill in simulink

Need an expert who can model a drill in Simulink. Working model of a drill needing for an improvment to behave more realistically as a drill to drill through plastic block.

  Project is on load frequency control using fpid

Project is on load frequency control using FPID tuned using GA and PSO algorithm and the system is a two area system.

  Number of packets received with time

Let x be the number of packets received with time -

  Build a matlab based graphical user interface

Build a Matlab based graphical user interface (GUI) that operates in conjunction with a base Matlab/ Simulink simulation program. Any base simulation is considered acceptable.

  Build a matlab based graphical user interface

Build a Matlab based graphical user interface (GUI) that operates in conjunction with a base Matlab/ Simulink simulation program. Any base simulation is considered acceptable.

Free Assignment Quote

Assured A++ Grade

Get guaranteed satisfaction & time on delivery in every assignment order you paid with us! We ensure premium quality solution document along with free turntin report!

All rights reserved! Copyrights ©2019-2020 ExpertsMind IT Educational Pvt Ltd