Reference no: EM13224298
Part A:
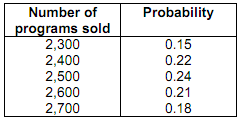
Every home football game for the last 8 years at Eastern State University has been sold out. The revenues from ticket sales are significant, but the sale of food, beverages, and souvenirs has contributed greatly to the overall profitability of the football program. One particular souvenir is the football program for each game. The number of programs sold at each game is described by the probability distribution given in the table below?

Each program costs $.80 to produce and sells for $2.00. Any programs that are not sold are donated to a recycling centre and do not produce any revenue.
a) Simulate the sales of programs at 10 football games. Use the random numbers listed below.
b) If the university decided to print 2,500 programs for each game, what would the average profits be for the 10 games that were simulated?
c) If the university decided to print 2,600 programs for each game, what would the average profits be for the 10 games that were simulated? Students can use the simulation module POM-QM for Windows for this question.
Part B:
Discuss how you will be able to use the Simulation Methodology in one of the following areas:
a. Project Planning - in determining the critical activities or the project duration
b. Inventory Control - in deriving the optimal order quantity of an item held in inventory.