Reference no: EM131430246
Simulate the process flow in a container terminal.
The objective of project is to study the impact of different berth assignment rules (e.g. first come first serve, priority according to vessels volume, assign larger vessels to larger berths etc.) So through the simulations of different berthing rules and I can obtain the key performance indicators of the container terminal, then to compare the advantages of different berthing rules.
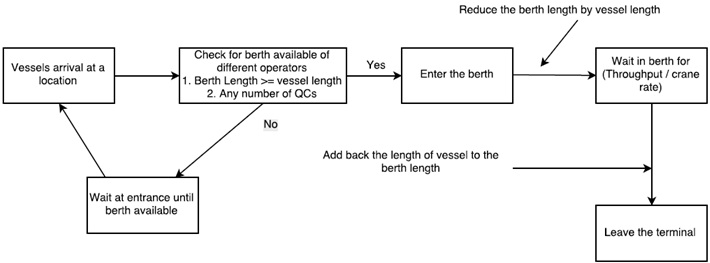
The flow is that 5 types of vessels will arrive at the terminal with different frequencies and they are exponentially distributed. Different types of vessels have different probability for calling 1 of the 4 terminal operators and the probability is shown above. The model should check first if the specific operator have enough length and QC available for processing the vessels, if yes, the vessel will enter the operator (locations), then the vessels will wait at the berth for processing (throughput / number of QC* crane rate) and then leave the terminal. If no space available, they will just wait at the beginning location until the specific operator is available.
Case 1: First Come first serve
Case 2: Larger vessels are processed first
Case 3: Assign vessels to idle berth first
Case 4: Assign smaller vessels to smaller berth first
You need to use the "attribute" function to define the length, QC requirement and vessel throughput to check the availability of berth, and then assign them to different berth when they are empty. After checking the remaining berth length and QC amount, when a vessel enter the berth, the length and QC quantity should be deducted, use this approach to control the movement of vessels in the terminal.
Still other approach that can achieve the goal can be used, not just limited to this method.
Flow chart
Attachment:- Data.rar
|
Determine the graphical display tool
: Determine the graphical display tool (e.g., Interaction Effects Chart, Scatter Chart, etc.) that you would use to present the results of the DOE that you conducted in Question 1. Provide a rationale for your response.
|
|
How many different colors could we display at any one time
: Assuming that a certain full-color (24-bit-per-pixel) RGB raster system has a 512-by-512 frame buffer, how many distinct color choices (intensity levels) would we have available? How many different colors could we display at any one time?
|
|
Explain the ways in which findings might be used in nursing
: Summarize the study, explain the ways in which the findings might be used in nursing practice, and address ethical considerations associated with the conduct of the study.Refer to the resource "Research Critique Guidelines" for suggested headings a..
|
|
What is the fraction of the total refresh time per frame
: What is the fraction of the total refresh time per frame spent in retrace of the electron beam for a noninterlaced raster system with a resolution of 1280 by 1024, a refresh rate of 60 Hz, a horizontal retrace time of 5 microseconds, and a vertica..
|
|
Simulate the process flow in a container terminal
: Simulate the process flow in a container terminal - The objective of project is to study the impact of different berth assignment rules (e.g. first come first serve, priority according to vessels volume, assign larger vessels to larger berths etc.)
|
|
Which design would be practical for a large study
: In a 500-750 word essay, compare and contrast the outcomes that would be derived from each design. Which design would be practical for a large study
|
|
What is the access time per pixel in each system
: Consider two raster systems with resolutions of 640 by 480 and 1280 by 1024. How many pixels could be accessed per second in each of these systems by a display controller that refreshes the screen at a rate of 60 frames per second? What is the acc..
|
|
What is the diameter of each screen point
: Suppose we have a video monitor with adisplay area that measures 12 inches across and 9.6 inches high. If the resolution is 1280 by 1024 and the aspect ratio is 1, what is the diameter of each screen point?
|
|
What are the explanatory variables
: What is the response variable?- What is n, the number of cases?- What is p, the number of explanatory variables?- What are the explanatory variables?
|