Reference no: EM132435354
Signals and Systems Labs Assignment -
Part A - Lab 1
1) Suppose we have a system with impulse response h(n) = {1, 2, 3, 2, 1}, and the input signal x(n) = {1, 2, -1, 3}. Calculate system output y(n) using the following methods:
a) Manually with the convolution formula
b) Manually using the folding table
c) Manually by solving the differential equation for the system
d) By programming the filler formula in MatLab
e) In MatLab using the command "conv"
f) In MatLab using the "filter" command
2) Repeat 1), but with impulse response h (n) = {1, 2, 3, 2, 1}.
3) Repeat 1) with the impulse response h (n) n = 0.5 u (n) and input signal x(n) = u(n). In all the part assignments, determine the first 10 values of the output.
4) Calculate the frequency function and draw the same (amount and phase) for the impulse responses found in task 1) - 3). Do this by
a) Directly calculate the frequency function based on its definition.
b) Using the command fft in Matlab
c) Using the command freqz MatLab
5) Suppose we have a signal containing the frequencies 1 kHz, 2 kHz and 4 kHz and sampled with 10 kHz.
a) Construct a filter that removes the frequencies 1 kHz and 4 kHz from this signal by appropriately placing poles and zeros.
b) Construct a filter that removes the frequencies 1 kHz and 4 kHz from this signal and which leaves the frequency component of 2 kHz (almost) unchanged in amplitude. Do this by placing poles and zeros appropriately.
Examine the proposed blanket the frequency functions in MATLAB using the commands zplane and freqz.
6) Create a low pass filter with each of the above windows that meets the following specification and with as few drops as possible (minimize M):
- dp = 1%
- wp = 0.30
- ws = 0.35
- ds = 40 dB
7) Create a high pass filter with each of the above windows that meets the following specification and with as few drops as possible (minimize M):
- dp = 3%
- wp = 0.37
- ws = 0.35
- ds = 30 dB
8) Create a bandpass filter with each of the above windows that meets the following specification and with as few drops as possible (minimize M):
- dp = 0.5%
- wp1 = 0.10
- wp2 = 0.20
- ws1 = 0.08
- ws2 = 0.25
- ds = 20 dB
9) Create a bandwrap filter with each of the above windows that meets the following specification and with as few drops as possible (minimize M):
- dp = 1%
- wp1 = 0.30
- wp2 = 0.40
- ws1 = 0.32
- ws2 = 0.38
- ds = 50 dB
10) Create a low pass filter with each of the above windows that meets the following Specification and with maximum attenuation in the stopband (minimize ds):
- M = 41
- dp = 1%
- wp = 0.30
- ws = 0.35
11) Write a brief summary of the results you obtained in task 6-10.
Frequency of Sampling
Use frequency sampling in MatLab to create filters as shown below.
To solve the data you must
- Define a suitable ideal filter (a filter with | H (ω) | = 0 or | H (ω) | = 1 and appropriate breakthrough rate as well as phase.
- Take samples on the ideal filter to calculate your impulse response
- Perform an analysis of the performance of the resulting filter
12) Repeat task 6).
13) Repeat task 8).
Ekvirippel filter
Use MatLab to create echo filter as shown below. You may use the implementation in MatLab of Parks-McClellan's (firpm) algorithm to create these filters.
14) Repeat task 6).
15) Repeat task 8).
16) Write a brief summary comparing the different methods you have used above (window method, frequency sampling and echo filter).
IIR filter
Use MatLab to create an IIR filter as shown below. You may use the completed ones functions in MatLab to create an analogue filter that you use as the basis for transformation.
17) Repeat task 6).
18) Repeat task 8).
19) Write a short summary comparing the different methods you have used above and the results you achieved with both the FIR filter and the IIR filter.
Part B - Lab 2
Lab 1 - Decimation and interpolation
Assume the following signal
X(t) = i=0∑5cos(2πFit)
with Fi = 100*i Replace 500 Hz → 450
Create x(n) by sampling with 1500 Hz
(a) Forming y1(n) by decimating by a factor of 3. Draw Y1(w).
(b) Forming y2(n) by interpolating by a factor of 2. Draw Y2(w).
b) Forming y3(n) by a frequency reversed by a factor 2/3. Draw Y3(w).
Lab2 - Sp in time domain
Suppose X(n) = Cos((2π*10*n)/1000)+N(n)
Where N(n) ? N(0, σ)
Estimate rXX = (τ)
σ = 0.1
σ = 1
σ = 10
Explain the result you receive.
Lab 3 -
1. Generate N sample normal distributed white noise in Matlab with average 0 and variance 1.
a) Estimate Spectrum with single periodogram for different values of data set N. Let N be 100, 1000, 10000, 100000.
Is the assessment worthwhile and consistent?
b) Filter the noise through an FIR filter with the impulse response [1, 1, 1, 1, 1] and redo the estimation. Can you see the influence of the FIR filter?
c) Compare the results with the true spectrum of the filtered noise?
d) Repeat b) and c) using Bartletts method, i.e. divide the sequence into a number of blocks of appropriate size and average image. Try a few different block lengths.
What is the difference?
1. Starting from previous lab 2 (Sp-time domain).
Estimate the spectral density of X (n) in the three different cases a) - c) and explain the result and what you see.
Lab 4 - Linear System
Assume the following two LTI systems
1) h(n)= [1,1,1,1,1,1]
2) h(n)= [1,-1,1,-1,1,-1]
a) Calculate the absolute amount of the frequency functions in order to analyze these implicitly analytically.
b) Use frequency sweep to estimate the absolute value of system frequency function.
c) Feed the system with white noise and study the output. Use the results to estimate the absolute amounts of system frequency functions.
d) Compare the results of a), b) and C).
Lab 5 -
In this task, we assume that we know the arrival time for a possible "echo". The received signal can be modeled as
H0 : No echo
r(k)=n(k) , k=0,...., N-1
H1 : Echo
r(k)= s(k)+n(k), k=0,...,N-1
where n(k) is white independent noise, n(k) ? N(0,σ) , k=0,..., N-1
Suppose that N=3 and S(k) = [2,3,2]
Define SNR= Psignal/Pnoise = (1/N k=0∑N-1s2(k))/σ2
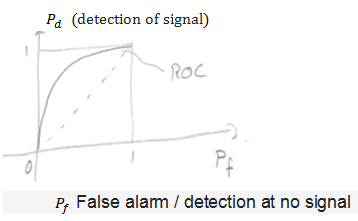
To measure performance, ROC is often uses (receiver operating characteristic)
Study the following detector
a) Signal-adapted filter
b) Energy detector ie 1/Nk=0∑N-1r2(k)
The advantage of B is that it works even if the form of the received signal is not known.
Complete the following tasks -
1) Simulate detector A and determine ROC then SNR = -10 dB, 0 dB and + 10dB
2) Repeat 1) but with detector B.
3) Compare the results you obtained in 1) and 2) with theoretically calculated values.
Attachment:- Signals and Systems Labs Assignment Files.rar