Reference no: EM131469893
1) Please note that the project report in PDF file should be self-contained and should not refer the reader to MSP/other software file for any of the deliverables. All the figures and graphs that are asked for should be integrated within the text. Additional figures and data not considered critical to understand the text can be placed in the appendices.
2) If you post to the wrong place, please post in the right place and send a message to the professor and the TA so that your incorrectly posted file can be removed. If, as frequently happens, you decide to make an improvement at the eleventh hour, have a different teammate post the new file and again let us know about removing the prior version.
3) File Naming. The file name for the report must be GP2_TeamName.pdf. The file name for the schedule should follow the same convention as the project report with the following variation: GP2_TeamName_Plan_NN_n.ext (where NN is the section number below I or II, and n is sub- section or item number 4, 2, or 3, ext is file extension depending on the software e.g. mpp for MS Project). Three points will be deducted if the file-naming format is not followed correctly.
4) The work described here is worth 195 points. The total project is worth 200 points including 5 points for the team charter.
Introduction
This group project has multiple parts:
I. Probabilistic scheduling of the project using PERT and simulation.
II. Development of a baseline schedule taking time, cost, and resources into consideration.
III. Development of a progress report and evaluation of the status of the project.
IV. Delay and disruption management and dealing with a troubled project.
Assume that the project will start April 1, 2017 and that all work is to be done on a five day per week basis, ignoring any holidays. As the group responsible for planning this project, you will provide the items described below to the executive committee. Actually, the teams will have to do only parts I and II. Parts III and IV are listed to show the next logical steps (You will work through similar steps in assignments in DNSC6262 class in future).
I. Probabilistic Scheduling of the project using PERT and simulation
Using the probabilistic data given in Table 1, answer questions I.1 and I.2 below using both PERT and Monte Carlo simulations (MCS) for each. Use only the critical path for PERT calculations. Where appropriate, provide copies of some of the software-generated diagrams and reports that you use to answer the questions.
Give dates (with corresponding project durations) at which you are 50, 80, and 99% sure that the entire project will be completed.
Provide a project duration range (not dates) at plus and minus ten percent about the probability of expected completion time. For example, if the expected completion time is d days, and the corresponding probability is p%, find the duration range corresponding to p-10% to p+10% probability.
Now compare the results from the two methods and describe your findings. Be sure to convey important details of your calculations and results.
Next, choose either the PERT or Monte Carlo results, above, to plan an implementation of the project at 80% schedule confidence. This is the schedule that you will be comfortable providing to your project team to ensure completion with an 80% confidence. Develop the schedule and present it using a Gantt chart and comment upon on it, being sure to explain why you chose PERT or Monte Carlo results as the starting point and the steps you took to create the schedule. The MCS schedule with most likely times and just the completion date corresponding to 80% is a feasible answer, but teams are expected to go beyond that to develop a schedule that accommodates potential human behavioral issues).
II. Development of a baseline schedule considering time, cost, and resources.
Please do this part independent of the calculations in Part I. First, make sure that your network is the same as the network diagram shown as Figure 1 at the end of this assignment. (If you like, you may assume that inexperienced but powerful administrators developed this diagram, and you are required to use its logic even if you do not agree with it). Assume that the only resources needed are R1 through R5, as described in Table 2. Temporarily assume unlimited availability
for each of these resources, and plan your project now using the deterministic times given in Table 2.
Unlimited Resource Schedule
Provide the unconstrained resource Gantt chart schedule and report its total cost. Please clearly state the assumptions made for resource costs.
Unlimited Resource Use
Create a set of five resource profiles, known as Resource Loading Charts, showing the peak use of each resource as function of time over the duration of the project. Please select the intervals such that there are at last 20 data points on X-axis.
For each resource, without any leveling or other adjustment, indicate the maximum number of units needed simultaneously.
Limited Resources
Now assume that in the time needed for the original, unlimited plan, only two-thirds of the funds needed for the total resource requirement will be available.
You may distribute the funds as you wish among the five resources. The remaining one-third is yours to spend on the project as you like after the original duration estimate has passed.
The client is looking for early completion of the project.
Using your knowledge of resource constrained project scheduling, develop a schedule. For the first period (original duration per the schedule in II.2.2) you must ensure that the cost does not exceed the 2/3 limit of the original budget (the primary goal) and that the resource profiles are leveled to the extent possible (a secondary goal). The organization also doesn't want to leave more than 1% of the budget unused in the first period.
For the remaining period (after the original duration) the goals are to complete the project quickly while maintaining a leveled resource profile. You can accomplish this by rescheduling activities but not by changing precedence relationships among activities, crashing or lengthening activities, or splitting activities. You can force rescheduling of activities by changing resource availabilities, but if you are using this option please verify that the software executes it correctly.
There should be no change in durations and scope/costs of individual activities. Provide a short paragraph describing your scheduling and leveling approach.
Provide a thorough recording and analysis of your leveling trials to achieve the schedule meeting the defined constraints.
Provide a table comparing using selected metrics for at least one trial in detail to what you chose as your final solution.
Save this constrained resource schedule as the baseline schedule for your project. Note the completion date of the project.
Produce a Gantt chart view of the baseline project schedule containing only project activities and no summary bars. Indicate the project's critical path and explain how the path was identified as critical.
List each resource's total requirement and total cost, and the associated split among the two time periods.
Show your new resource allocation levels (Resource Loading Charts). The charts should show peak units per period. Please select the intervals such that there are at least 20 data points on X-axis.
Produce cash flow graphs that show the planned expenditure per unit time and the cumulative expenditure as a function of time. Again, please select the intervals such that there are at last 20 data points on X-axis. The graphs should clearly identify the end of the first period.
Write a brief (< 1 page) memorandum to the project's sponsor that summarizes the main points of your final baseline schedule. In your memo convince the reader that the schedule produced is near optimal and why.
Additional Requirements and Words of Advice
A. Units Assigned
Assume days for the time unit and dollars for the monetary unit. (If we wanted to, we could come back later and scale the money by any desired factor.)
B. Text Page Limits
The page limit for the text is 9, 1.5 spaced, 11 point serif font. Pages used for tables and figures do not count toward the page limit, neither do the pages for cover sheet, table of contents, references, and any appendices. Each table or figure must be captioned at its location and described in the text. Do not try to save space by writing only, "See Figure xx for the answer." Even when a graph is called for, e.g., a Resource Loaded Chart, the text must point the reader to the graphic(s) and indicate what is to be observed.
C. Keep Talking to Each Other!
Each team must make its own budget allocations; run its own simulations; plot its own graphs; and write its own arguments. We will deal strictly with plagiarism. Before the end, however, I encourage you as strongly as I can to talk not merely with your teammate, but with anyone and everyone else in the class, in both on-campus and distance modes! You can discuss details as
much as you like; but you cannot share any files (.mpp, .docx, .pdf, etc.) in soft copy or hard copy, and of course, you simply cannot copy from other teams' work. You cannot have another student in the class review your work until after all teams in both sections have submitted the report.
D. Avoid The Student Syndrome
As we near the end of the semester, we hope you find this assignment straightforward. We know you have many requirements in your busy lives, but please do not wait until the last minute to begin this work. While straightforward, it will require time, and we would like to see improved writing along with the right answers.
|
Activity
|
Mean or Mode
|
min
|
max
|
Predecessors
|
Distribution
|
|
A
|
6
|
3
|
9
|
-
|
N
|
|
B
|
-
|
4
|
16
|
A
|
U
|
|
C
|
-
|
6
|
20
|
B
|
U
|
|
D
|
30
|
25
|
35
|
B
|
N
|
|
E
|
85
|
75
|
95
|
A
|
N
|
|
F
|
120
|
90
|
150
|
A
|
T
|
|
G
|
42
|
35
|
49
|
D
|
N
|
|
H
|
38
|
35
|
41
|
E,F,G
|
T
|
|
I
|
8
|
5
|
11
|
H
|
Beta
|
|
J
|
35
|
30
|
40
|
H
|
N
|
|
K
|
8
|
5
|
11
|
J,V
|
N
|
|
L
|
29
|
24
|
34
|
C
|
N
|
|
M
|
-
|
10
|
20
|
O,N
|
U
|
|
N
|
-
|
30
|
46
|
L
|
U
|
|
O
|
-
|
6
|
12
|
L
|
U
|
|
P
|
11
|
8
|
22
|
M
|
T
|
|
Q
|
-
|
10
|
16
|
P
|
U
|
|
R
|
15
|
10
|
20
|
Q
|
N
|
|
S
|
-
|
35
|
49
|
R
|
U
|
|
T
|
4
|
1
|
7
|
R
|
N
|
|
U
|
-
|
15
|
23
|
S
|
U
|
|
V
|
35
|
25
|
45
|
I,O,N
|
N
|
|
W
|
4
|
1
|
7
|
R
|
Beta
|
|
X
|
12
|
8
|
16
|
C
|
N
|
|
Y
|
15
|
10
|
20
|
X
|
N
|
|
Z
|
9
|
6
|
12
|
J,V,Y
|
N
|
|
Aa
|
-
|
12
|
18
|
B
|
U
|
|
Bb
|
8
|
4
|
12
|
Aa
|
N
|
|
Cc
|
-
|
4
|
10
|
K
|
U
|
|
Dd
|
4
|
1
|
7
|
W,Z
|
N
|
|
Ee
|
-
|
4
|
8
|
Bb, Cc, Dd, U, T
|
U
|
Table 1: Probabilistic Data. "N" represents a normal distribution; "U" is uniform; "T" is triangular; and "Beta" is the PERT β distribution. The missing mean values need to be calculated using formulas corresponding to distribution specified for the activity. Please do not use the duration values from either table 2 or those specified on the network in Figure 1.
|
Activity
|
Duration
|
R1
|
R2
|
R3
|
R4
|
R5
|
|
A
|
6
|
2
|
2
|
3
|
4
|
1
|
|
B
|
10
|
1
|
4
|
1
|
4
|
4
|
|
C
|
13
|
2
|
4
|
5
|
5
|
1
|
|
D
|
30
|
3
|
4
|
0
|
2
|
0
|
|
E
|
85
|
1
|
4
|
3
|
5
|
2
|
|
F
|
120
|
5
|
3
|
3
|
3
|
0
|
|
G
|
42
|
0
|
1
|
4
|
3
|
4
|
|
H
|
38
|
5
|
5
|
1
|
4
|
0
|
|
I
|
8
|
5
|
1
|
1
|
5
|
4
|
|
J
|
35
|
0
|
4
|
3
|
3
|
4
|
|
K
|
8
|
4
|
5
|
1
|
2
|
5
|
|
L
|
29
|
5
|
4
|
1
|
2
|
2
|
|
M
|
15
|
5
|
2
|
1
|
1
|
4
|
|
N
|
38
|
5
|
5
|
2
|
1
|
0
|
|
O
|
9
|
2
|
1
|
2
|
2
|
0
|
|
P
|
11
|
0
|
2
|
0
|
2
|
2
|
|
Q
|
13
|
2
|
5
|
3
|
4
|
5
|
|
R
|
15
|
2
|
3
|
2
|
4
|
1
|
|
S
|
42
|
2
|
5
|
5
|
1
|
4
|
|
T
|
4
|
0
|
2
|
5
|
1
|
1
|
|
U
|
19
|
5
|
2
|
0
|
2
|
0
|
|
V
|
35
|
2
|
2
|
1
|
0
|
2
|
|
W
|
4
|
0
|
3
|
0
|
3
|
5
|
|
X
|
12
|
2
|
3
|
2
|
0
|
0
|
|
Y
|
15
|
4
|
2
|
2
|
0
|
1
|
|
Z
|
9
|
1
|
4
|
4
|
4
|
4
|
|
Aa
|
15
|
5
|
5
|
1
|
0
|
4
|
|
Bb
|
8
|
3
|
5
|
2
|
5
|
2
|
|
Cc
|
7
|
0
|
1
|
0
|
2
|
2
|
|
Dd
|
4
|
2
|
4
|
2
|
0
|
1
|
|
Ee
|
6
|
5
|
3
|
1
|
4
|
3
|
Table 2: Resource Data. For each resource, the table shows the total resource intensity, RI , demanded throughout the deterministic duration of each task. Each resource, Rn, costs n currency units per time unit, e.g., R5 has a cost rate five times the rate of R1 and over a six-unit time duration would require 30 currency units.
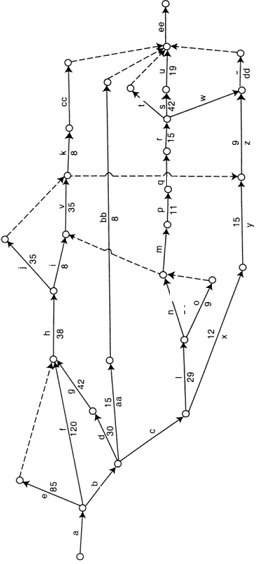
Figure 1: Network Diagram.