Run the simple linear regression and summarize the results

Assignment Help Basic Statistics
Reference no: EM131747354

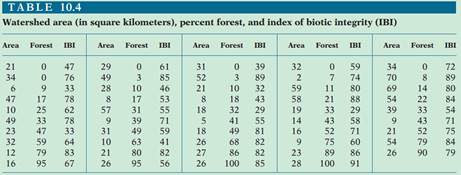
Question - Predicting water quality. The index of biotic integrity (IBI) is a measure of the water quality of streams. IBI and land use measures for a collection of streams in the Ozark Highland ecoregion of Arkansas were collected as part of a study.9 Table 10.4 gives the data for IBI, the percent of the watershed area that was forest, and the area of the watershed in square kilometers for streams in the original sample with area less than or equal to 70 square kilometers.

(a) Use numerical and graphical methods to describe the variable IBI. Do the same for area. Summarize your results.

(b) Plot the data for IBI and area and describe the relationship. Are there any outliers or unusual patterns?

(c) Give the statistical model for simple linear regression for this problem.

(d) State the null and alternative hypotheses for examining the relationship between IBI and area.

(e) Run the simple linear regression and summarize the results.

(f) Obtain the residuals and plot them versus area. Is there anything unusual in the plot?

(g) Do the residuals appear to be approximately Normal? Give reasons for your answer.

(h) Do the assumptions for the analysis of these data using the model you gave in part (c) appear to be reasonable? Explain your answer.

869_figure.png

Reference no: EM131747354

Questions Cloud

How the concepts help align the organizations values : Discuss at least two concepts from class that are elements of a marketing plan and are important tools to your entrepreneurial business' success.
Discuss an accurate estimate of the girder weight : The total depth of the girder will be 73 inches, and continuous lateral support will be provided
One-variable statistical calculator applet : Summarize data for one variable. The Data Sets tab of the One-Variable Statistical Calculator applet allows you to select a data set that contains the IQ
Probability that the entire shipment will be sent back : If the true proportion of defective plywood sheets is 0.05, what is the probability that the entire shipment will be sent back?
Run the simple linear regression and summarize the results : Run the simple linear regression and summarize the results. Give the statistical model for simple linear regression for this problem
Is there a general pattern : Is there a general pattern? Do you think that the comparison of Alabama and Alaska that we noticed could be part of a general pattern
Discuss standard threaded round rod : Select a standard threaded round rod to support a factored tensile load
Describe the plot : Describe the plot. Examine the display in the Scatterplot tab carefully.
Review problem of population statistics : Demographics and Population Statistics. According to National Geographic, 28% of Canadians are of British descent. Suppose 150 Canadians in Alberta.

Reviews

Write a Review

Basic Statistics Questions & Answers

  Statistics-probability assignment

MATH1550H: Assignment:  Question:  A word is selected at random from the following poem of Persian poet and mathematician Omar Khayyam (1048-1131), translated by English poet Edward Fitzgerald (1808-1883). Find the expected value of the length of th..

  What is the least number

MATH1550H: Assignment:  Question:     what is the least number of applicants that should be interviewed so as to have at least 50% chance of finding one such secretary?

  Determine the value of k

MATH1550H: Assignment:  Question:     Experience shows that X, the number of customers entering a post office during any period of time t, is a random variable the probability mass function of which is of the form

  What is the probability

MATH1550H: Assignment:Questions: (Genetics) What is the probability that at most two of the offspring are aa?

  Binomial distributions

MATH1550H: Assignment:  Questions:  Let’s assume the department of Mathematics of Trent University has 11 faculty members. For i = 0; 1; 2; 3; find pi, the probability that i of them were born on Canada Day using the binomial distributions.

  Caselet on mcdonald’s vs. burger king - waiting time

Caselet on McDonald’s vs. Burger King - Waiting time

  Generate descriptive statistics

Generate descriptive statistics. Create a stem-and-leaf plot of the data and box plot of the data.

  Sampling variability and standard error

Problems on Sampling Variability and Standard Error and Confidence Intervals

  Estimate the population mean

Estimate the population mean

  Conduct a marketing experiment

Conduct a marketing experiment in which students are to taste one of two different brands of soft drink

  Find out the probability

Find out the probability

  Linear programming models

LINEAR PROGRAMMING MODELS

Free Assignment Quote

Assured A++ Grade

Get guaranteed satisfaction & time on delivery in every assignment order you paid with us! We ensure premium quality solution document along with free turntin report!

All rights reserved! Copyrights ©2019-2020 ExpertsMind IT Educational Pvt Ltd