Results of a survey conducted in august

Assignment Help Basic Statistics
Reference no: EM131816904

Leon James and Diane Nahl posted results of a survey conducted in August 2000, where respondents were asked about various driving habits. This table classifies 1,086 participants according to type of car driven, and whether or not they were in the habit of making insulting gestures at other drivers. Notice that, unlike most tables encountered in this book, the explanatory variable (type of car) is indicated in columns and the response (gestures or not) is in rows.

1463_indicated in columns and the response.png

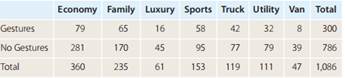
a. Before calculating any conditional probabilities, identify the types of cars whose owners you would suspect to have a tendency to make insulting gestures at other drivers.

b. For each type of car, find the (conditional) probability that surveyed drivers of that type of car make insulting gestures.

c. Comment on whether or not your suspicions in part (a) were correct.

d. To three decimal places each, find the probability of driving a van (P(V)), the probability of making insulting gestures (P(G)), and the probability of driving a van and making insulting gestures (P(V and G)). e. Check if P(V and G) P(V)  P(G) to see if the events V and G are independent, and explain the outcome. f. You found P(G given V) in part (b). Check if P(V and G) P(V)  P(G given V) and explain the outcome. (It may help you to work with the original fractions instead of converting to decimals.)

g. Which would you suspect to be higher: the probability of making insulting gestures (P(G)), or the probability of making insulting gestures given that someone drives a sports car (P(G given S))? Report the two probabilities to three decimal places.

h. Find the overall probability of driving an economy car, a family car, a luxury car, or a van.

i. Find the probability of making insulting gestures, given that someone drives an economy car, a family car, a luxury car, or a van.

j. Are drivers of economy cars, family cars, luxury cars, and vans less likely in general to make insulting gestures?

k. Did the surveyors allow for overlapping of categories, in cases where someone drives more than one type of car?

Reference no: EM131816904

Questions Cloud

Probability of flying a kite or dancing : The probability of dancing at least once that year was 0.077. Why is it not correct to conclude that the probability of flying a kite or dancing was 0.100?
Health and sexual behavior : The health department in a certain county surveyed nearly 5,000 households in 2002 about health and sexual behavior.
Prepare a summary report to help the president : The static budget had been based on a budget of $.35 revenue per passenger mile. A passenger mile is one paying passenger flown one mile.
Which view do you take with regard to the situation describe : Describe a situation where you were in a biased situation and you needed to convince others to believe you, despite your bias What did you do?
Results of a survey conducted in august : Leon James and Diane Nahl posted results of a survey conducted in August 2000, where respondents were asked about various driving habits.
List five potential problems and risks concerning systems : Suppose you represent an investor group that is acquiring hospitals across the nation and integrating them into a unified system.
Calculate price and quantity variances for nursing costs : Hospital Costs and Explanation of Variances The emergency room at Rochester General Hospital uses a fl exible budget based on patients seen as the measure.
Probability of a voter supporting stricter : According to exit polls from the 2000 presidential election, the probability of a voter supporting stricter gun control laws was P(C) 0.60
How the artworks approach questions as to the role of artist : The history of Abstract Expressionism and Pop Art. How the artworks approach questions as to the role of the artist and the role of art in society?

Reviews

Write a Review

Basic Statistics Questions & Answers

  The sum of the values obtained in a random sample

The sum of the values obtained in a random sample of size n = 5 is to be used to test the null hypothesis that on the average there are more than two accidents per week at a certain intersection (that λ > 2 for this Poisson population) against the..

  Develop the estimated regression equation for data

Develop the estimated regression equation for data and plot the residuals against ". Does the residual plot support the assumptions about e? Explain.

  Sketch a curve for this distribution

Use the 68-95-99.7 Rule to sketch a curve for this distribution, marking off the weights that are within 1, 2, and 3 standard deviations of the mean.

  How many envelopes do you think they will need to open

Admissions officers search the pile of envelopes, opening them at random to look for three applicants with SAT totals over 1800. How many envelopes do you think they will need to open?

  Construct a 95 confidence interval for the mean gas price

on august 82012 the national average price for a gallon of regular unleaded gasoline was 3.63. the prices for a random

  Assess probability distribution of this uncertain quantity

Using all of the information and insight you have, assess the probability distribution of this uncertain quantity.

  Prices for regular unleaded gasoline

The U.S. Energy  Information Administration reports the following prices for regular unleaded gasoline in Germany from 2003 through 2008. Source: U.S. Energy Information Administration, Annual Energy Review 2008, p. 321.

  Find a value of the sample size n

What is the probability that the sample proportion is more than 0.37?- Find a value of the sample size n such that the probability that the sample proportion is less than 0.40 is 0.95.

  Business statistics hypothesis example

Suppose we sample five boys and five girls, and find that the average height of the boys is 0.5 inches more than the average height of the girls.

  Three-week training session

Then the four employees in each group were randomly assigned to the four training methods and retested after completion of the three-week training session.

  Approach to performance appraisal

The graphic rating scale system is a very common approach to performance appraisal. It is simple to implement and to use, but tends to be very subjective. For instance, on a scale from 1 to 5 for a certain characteristic, 4 means good.

  Computing a linear regression equation to predict the

computing a linear regression equation to predict the future values of the dependent variable y.1.nbsp the estimators

Free Assignment Quote

Assured A++ Grade

Get guaranteed satisfaction & time on delivery in every assignment order you paid with us! We ensure premium quality solution document along with free turntin report!

All rights reserved! Copyrights ©2019-2020 ExpertsMind IT Educational Pvt Ltd