Reference no: EM13336
Part - 1
Prepare an Excel graph showing the individual components and summated resultant waveform of the odd harmonic series resulting in an approximate square wave.
The series is
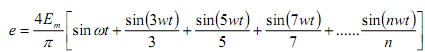
Note that t is the time, Em is the peak value of the wave and ω is 2 x ∏ x f.
You should select a value of Em and t to suit your scale, my example uses 50Hz as the basis for simplicity.
A table and graph using MS Excel or Open Office, and submit on paper.
Part - 2
Make an Excel graph depicting the individual components and summated resultant waveform of the harmonic series resulting in an approximate sawtooth wave.
The series is:
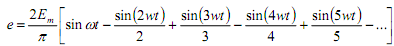
You should select a value of Em and t to suit your scale, my example uses 50Hz as the basis for simplicity.
Show a table and graph using MS Excel or Open Office.
Part - 3
Excel graph showing an approximate exponential curve for the current through an R-L series circuit.
In this example L is a pure inductance of 100mH and R is a perfect resistor of 10 Ohms and the driving voltage is 10V DC.
Show the value at over several time constants and also identify spot values at t = 1 time constant and t = 3 time constants.
Show a table and graph using MS Excel or Open Office.