Required rate of return for a division of an organization

Assignment Help Basic Statistics
Reference no: EM13245606

You are involved in the development of the statistics budget for Asteroid Hospital, Inc. Your hospital delivers many different types of medical services over the budget cycle, which runs concurrently with the calendar year, January through December. You are planning the statistics budget for valve replacements for a biennial cycle which will run from January 2012 through December 2013.

2498_Pure-play technique.png

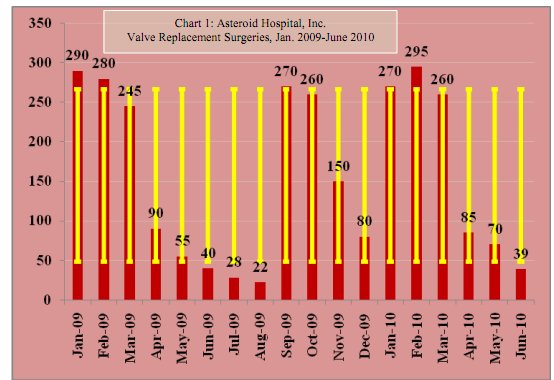
It is July 2011, and you have budget data running from January 2009 through June 2010. You have plotted your valve replacement data on a chart using a histogram (i.e., bar chart), shown in Chart 1. The red bars on the chart represent the number of valve replacements performed by Asteroid Hospital each month. You have included data labels for each bar corresponding to the monthly frequency of valve replacements. You have also included an error bar (i.e., high-low bar) for each month. These are the yellow bars which chart the standard deviation for the 18 month distribution of valve replacements.

The valve replacement distribution yields certain descriptive statistical findings, shown in Table 1, relating to the historical monthly frequency of valve replacements between which include January 2009 and June 2011

1. Based upon the findings shown in Chart 1 and Table 1, upon what should you base your projections for valve replacements in completing this part of the statistics budget? (Select only one answer)

A. Mean average or median average but not the geometric mean or harmonic mean average

B. Mean average, R squared, and geometric mean average

C. Mean average and R squared, with close attention to the average deviation and both the upper and lower limits of the standard deviation

D. Averages are irrelevant in this case. Seasonal fluctuations must be taken into account.

E. Mean average and R-squared with close attention to the standard deviation but not the average deviation

F. Trend line using R-squared as a guide

G. Special use of the harmonic mean using the trend line as a relevant range

H. Slope and intercept using R squared as a relevant range

2. Please fill in the blanks for the following formula. Select only one answer choice.

Revenue minus ________________ equals Contribution Margin minus Fixed Costs equals ________________.

A. Breakeven dollars, net income
B. Variable costs, profit
C. Operating revenue, operating income
D. net income, breakeven dollars

You may recall that in one of our lectures we went over a few techniques that were informational only. It was stipulated that you would not be held accountable for this informational-only information on quizzes. This stipulation has been upheld, and no questions were asked on the informational-only material on quizzes. However, no such stipulation was made regarding extra credit. So, please match the following terms.

3. This is a technique used to determine a theoretically appropriate required rate of return of an asset. The measure of risk is the stock's market beta. The market, which is a large collection of stocks such as the S&P 500 Index, has a beta of 1.0. A stock with a beta of 2.0 has twice the volatility of returns as the market, while a stock with a beta of 0.50 has half the volatility of returns as the market. Because relative volatility measures market risk, a low beta (< 1.0) is less risky than the market, while a high beta (> 1.0) is more risky than the market. Which answer choice identifies this description? Choose only one answer.

A. Kaplan Meier Scale
B. Capital Asset Pricing Model (CAP-M)
C. Fisher exact pricing model
D. Profitability index

4. The expected return of a financial asset that can be modeled as a linear function of various macroeconomic factors or theoretical market indices, where sensitivity to changes in each factor is represented by a factor-specific beta coefficient. Which answer choice identifies this description? Choose only one answer.

A. Weighted average cost of capital (WACC)
B. Weighted probability model
C. Capital asset pricing model (CAP-M)
D. Arbitrage pricing model

5. This represents a required rate of return for a division of an organization that has risk characteristics that differ from the risk characteristics of the overall organization. Which answer choice identifies this description? Choose only one answer.

A. Pure-play technique
B. Fisher exact pricing model
C. Linear programming simplex model
D. Cross rank test model

Reference no: EM13245606

Questions Cloud

Find the acceleration of the rocks : Some sliding rocks approach the base of a hill with a speed of 18.0m/s . The hill rises at 40.0? above the horizontal and has coefficients of kinetic and static friction of 0.390 and 0.650, Find the acceleration of the rocks
Explain contained traces of water or ethanol : If the sample of the complex ion compound that you prepared had not thoroughly dried, but contained traces of water or ethanol would this make your value of x too high or too low? Or would it not affect your results at all? Explain.
What would be the benefits of an open free market : 1. What do you think will be the basic problem of financing Social Security in the next 25 to 30 years 2. What would be the benefits of an open, free market for human organs 3. What do you think of a recommendation to privatize Social Security
In looking at gdp we see that not all aspects are counted : In looking at GDP we see that not all aspects are counted. Do you find that the items like buying a home or a used car should be counted in GDP?
Required rate of return for a division of an organization : Required rate of return for a division of an organization that has risk characteristics that differ from the risk characteristics of the overall organization. Which answer choice identifies this description
How many photons/sec does it receive from the man : A drone, flying 300m above ground, observes a man walking on a road in a cold night (0°C). how many photons/sec does it receive from the man and from a similar surface of road
Do you think business cycles would exist, or be as severe : Do you think business cycles would exist, or be as severe, if these economic statistics were not reported on a regular basis or at all?  Why or why not?
Is us having trade deficits or trade surplus with canada : Is U.S. having trade deficits or trade surplus with Canada and Mexico Remember U.S. imports oil from both countries. Is U.S. demanding for more oil during the recession
What is the primary function of banks in the macro economy : What is the primary function of banks in the macro economy? How do banks facilitate the circular flow?

Reviews

Write a Review

Basic Statistics Questions & Answers

  Calculate the value of the test statistic

A random sample of 51 observations was selected from a normally distributed population. The sample mean was x = 88.6 , and the sample variance was s2 = 38.2.

  Determine the least squares trend equation

The following table lists the annual amounts of glass cullet produced by Kimble Glass Works, Inc. Determine the least squares trend equation. Estimate the amount of scrap for the year 2005.

  Create confidence interval for mean score of all students

Thirty randomly selected students took the calculus final. If the sample mean was 79 and the standard deviation was 8.5, construct a 99% confidence interval for the mean score of all students.

  Hypothesis test for difference having two population mean

At the .05 significance level, is the number of units produced on the afternoon shift larger?

  Regression analysis-gnp case

Examine relationship between GNP per capita and the percentage of respondents willing to pay more taxes. Create a table using the data below for the GNP per capita and the percentage willing to pay higher taxes.

  Absolute frequency relative frequency

The data in the following tables are some of the results of an Internal Revenue Service survey of taxpayers. Analyze and interpret the data.

  Find the probability for question

What is the probability that the male sample will have at most three more days of absences than the female sample?

  Scientific method in practice

Choose a research article from your field.Write the five hypotheses that this study is testing.Write both the null and alternative hypotheses for each one.

  Test the claim that the heights of female supermodels

Use a 0.05 significance level to test the claim that the heights of female supermodels vary less than the heights of women in general.

  Independent and dependent variable from your place of work

Does a regression model imply causation? Why or why not? Provide an example which provides and independent and dependent variable from your place of work.

  What sampling method is best suited for a survey

What sampling method is best suited for such a survey? Why? Draw the sample using the random number table and bring out the rationale of the procedure. Limit your sample to 25 persons.

  Hypothesis test for difference between two means

What is the 95% confidence interval for the difference between the mean prices of the two models?

Free Assignment Quote

Assured A++ Grade

Get guaranteed satisfaction & time on delivery in every assignment order you paid with us! We ensure premium quality solution document along with free turntin report!

All rights reserved! Copyrights ©2019-2020 ExpertsMind IT Educational Pvt Ltd