Reference no: EM133124379
Fourier Representation Using MATLAB
The purpose of this lab is to use MATLAB to represent continuous-time and discrete-time signal using Fourier series for periodic signals and Fourier transform for aperiodic signals.
1. Fourier Series Representation of Periodic Signals
For a periodic signal x(t) with period T0, we have shown that it can be expressed as a sum of com-plex exponential signals. For example, if x(t) is continuous-time, its Fourier series representation is
x(t) = Σk=−∞+∞ Dkejkω0t
where the Fourier series coefficients ak are given by
Dk = -1/T0 ∫T0 x(t) e-jkω0tdt
In practice, x(t) is approximated by truncating the summation to include only the first N har-monics. That is,
X(t) ≈x·(t) = Σk=−NN Dkejkω0t
Similarly, when x(t) is discrete-time, its Fourier series representation is
x[n] = Σk=<N0> Dkejkω0t
where the Fourier series coefficients Dk are given by
Dk = 1/N0 ∫n=<N0> x(n)e-jkω0n
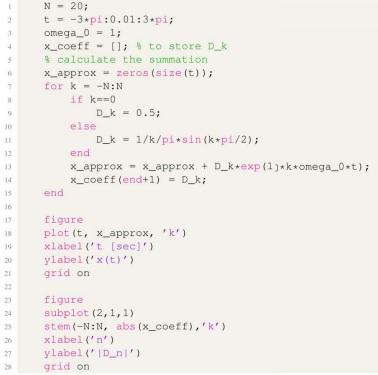
Let's take for example the following periodic signal
x(t) = 1, -Π/2 ≤ t < Π/2
x(t) = 0, Π/2 ≤ t < 3Π/2
and To = 2Π.
From the leacture, the Fourier series coefficients of x(t) we given by
Dk = 0.5, k = 0
Dk = 1/kΠ sin(kΠ/2), k ≠ 0
The code below can be used to plot x(t) using its truncated Fourier series when N = 20 as well as its Fourier spectra |Dk| and ∠Dk.
1.1. Task 1
Repeat the exercise above for N = 5, N = 11, and N = 99 and comment on the results.
2. Numerical Computation of Dk
So far, we assumed we know the Fourier series coefficients of the signal. Now, we will use the function fft (Fast FourierTra sfonn) in MATLAB to approximate the exponential Fourier spectra of the signal.
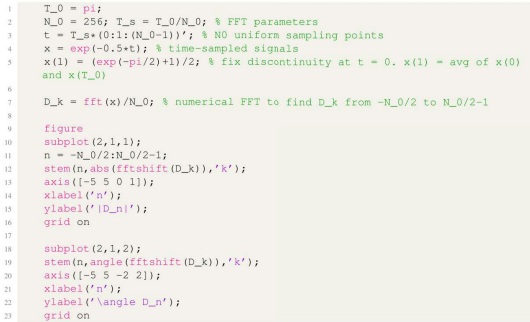
Let's take for example the periodic signal
x(t) = e-0.5t, 0 ≤ t ≤ Π
and T0 = Π.
Without deriving the expresaion for Dk the code below can he used to plot the. Fourier spectra |Dk| and ∠Dk of x(t).
Task 2
Repeat the exercise above for the periodic signal below.
x(t) = 0.5t, 0 ≤ t ≤ 2
and T0 = 2.
3. Fourier Transform Representation of Aperiodic Signals
For a continuous-time signal x(t), we have shown that its frequency-domain representation is given by the Fourier transform X(jω) such that
X(jω) = -∞∫+∞ x(t) e-jωt.dt
and the inverse Fourier transform is
X(t) = 1/2Π -∞∫+∞ X(jω) ejωtdω
The function fft in MATLAB can also be tried to find the Fourier transform representation of aperiodic signals.
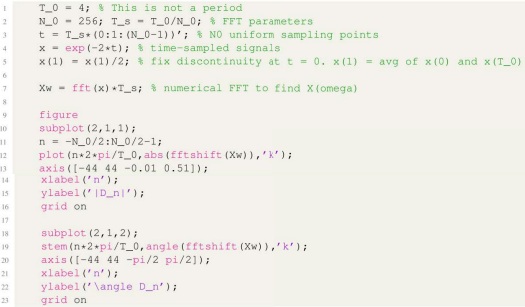
Let's take for example the following periodic signal
x(t) = e-2t, t ≥ 0
From the lecture, the Fourier transform of x(t) is given by
X(jω) = 1/(2+jω) → |x(jω)| = 1/√(4+ω2) and ∠X(jω) = -tan-1(ω/2)
Now, let's confirm that result using the following code.
Task 3
Repeat the exercise above for the signal below.
x(t) = 1 - 2 e-0.5t, t > 0