Recreate the matrix of factor loadings in tabular form

Assignment Help Applied Statistics
Reference no: EM131964980

Statistics Homework -

Q1. Exploratory Factor Analysis

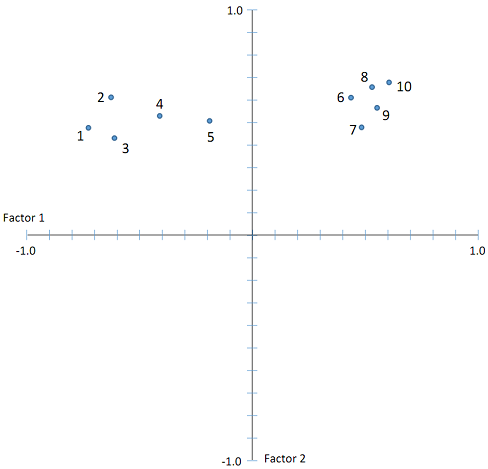
1. Below is a loading plot for two factors of a 10-item test. The two axes describe the unrotated factor solution for the two factors, with each axis reflecting the item loadings on the two factors. From this plot, (a) recreate the matrix of factor loadings, in tabular form (hint: a ruler should make this easy). (b) Explain whether a rotation is needed and if so, what kind? (hint: you may need to draw on a printout to figure this out) (c) Do you see any problems with any of the items (i.e., either with or without rotation)? (d) If all of the factors (i.e., not just the two extracted here) accounted for 100% of the variance in the set of 10 items, what kind of analysis was run? (e) For this kind of analysis (the one you identified in part d), if the first factor had an eigenvalue of 5 and the second factor had a value of 2, then what was the average percentage of variance accounted for by the remaining factors?
1256_figure.png

Q2. Confirmatory Factor Analysis

You have a 10-item test of leadership potential. Four items assess agency (i.e., being a good task-master), four items assess communion (i.e., being a good listener), and two items assess conscientiousness (i.e., being responsible). In the space below, (a) draw the overall confirmatory factor model as completely as possible. (b) Is this model likely to be identified? How do you know this? (And I mean specifically, with numbers to back up your knowledge) (c) Based on what you know from parts a and b, what problems might you anticipate with the measure? (d) After examining some initial data, the modification indices suggest that the residual of the fourth item of the agency factor is correlated with the residual of the second item of the conscientiousness factor. Draw this parameter in the model and explain whether it would be a good idea or not to include it in future models of the measure.

Q3. Measurement Equivalence

You are also interested in whether your test of leadership potential functions equivalently for males and females. (a) Recreate 2 drawings of the overall model from problem 5, though leave out the correlated measurement error (one for males and one for females, ideally side-by-side or top and bottom on the same sheet if you can fit it legibly). Using lowercase letters, indicate the constraints that are needed to examine metric equivalence. (b) Using numbers, indicate in the figure the constraints that are needed to examine measurement error equivalence. There is no need to include constraints for scalar equivalence. (c) If you find that a model estimating all parameters separately for males and females fits significantly better (i.e., according to the χ2) than the model in part a, what would you conclude? (d) What would you conclude if the model estimating all parameters separately for males and females fit worse than the model in part a?

Reference no: EM131964980

Questions Cloud

The difference in symmetric and symmetric encryption : Examine the fundamental differences and similarities between asymmetric and symmetric encryption.
What is the contract size of the euro fx futures contract : What is the contract size of the Euro FX futures contract? What about British Pound futures contract size? Are they the same?
Most important to you in the future : How will what you learned change the way you solve problems?
Discuss the hash functions and message authentication : Stallings states, "...perhaps the most versatile cryptographic algorithm is the cryptographic hash function."
Recreate the matrix of factor loadings in tabular form : Statistics Homework - From this plot, (a) recreate the matrix of factor loadings, in tabular form (hint: a ruler should make this easy)
What are the types of budgets organizations can use : What are the types of budgets organizations can use? how are they different? why would a company choose 1 type over another?
Discuss the essential nature of empowered teams : Discuss the essential nature of empowered teams. Discuss contemporary leadership philosophies and which you believe to be most effective.
Important for organizations to budget : What would be an example as to why these reasons are so important for organizations to budget?
Briefly describe the office of management and budget : Examine two (2) major mistakes The Office of Management and Budget made with cryptographic software.

Reviews

len1964980

5/1/2018 4:55:24 AM

Graduate level statistics homework - scale development, confirmatory factor analysis, exploratory factor analysis, measurement equivalence etc. After examining some initial data, the modification indices suggest that the residual of the fourth item of the agency factor is correlated with the residual of the second item of the conscientiousness factor. Draw this parameter in the model and explain whether it would be a good idea or not to include it in future models of the measure.

Write a Review

Applied Statistics Questions & Answers

  Additional information from iverstine and walker

1. Does Steve need additional information from Iverstine and Walker? 1. Does Steve need additional information from Iverstine and Walker?

  Compute the monthly nosocomial infection rates

Compute the monthly nosocomial infection rates and provide two bar graphs depicting the infection rate for each month for the past 2 years. Then analyze the graphs and indicate data trends.

  What is the point estimation for the mean of the population

A New York restaurant would like to estimate the average amount customers spend for dinner. A sample of size 49 customers resulted an average of $32.60. Assume the population standard deviation is $5.a. What is the point estimation for the mean of th..

  Develop a regression model

Develop a regression model that could be used to predict the final average in the course based on the first test grade. Predict the final average of a student who made an 83 on the first test.

  Create two histograms and provide interpretations

Create two histograms and provide interpretations. Calculate measures of central tendency and dispersion and provide interpretations.

  Find the descriptive statistics for the county

Find the following descriptive statistics for the county where your college or university is located Median household income.

  The results of computerworld annual job satisfaction surve

The results of Computerworld's annual job satisfaction survey showed that 28% of IS managers were very satisfied with their job. 46%= somewhat satisfied, 12% neither satisfied or dissatisfied, 10% dissatisfied, and 4% very dissatisfied.

  Cost of flying listed below are costs

Cost of flying listed below are costs

  The value of the coefficient of determination

Interpret regression results and the value of the coefficient of Determination. Predict the value of Y when X is equal to 10. Calculated the correlation coefficient between Y and X. Test to determine if there is a significant relationship betwe..

  The probability that the true value of the mean amount of ti

Suppose that 30 people have been asked in a survey about how many hours they spend watching TV per day. Then, use these data to find a 95% confidence interval for the mean amount of time spent watching TV is 1.5 to 3.2 hours. Which statement is NOT t..

  Let x be a normally distributed random variable with x

Let X be a normally distributed random variable with x= 100 and n= 10. Find the probability that X  is between 70 and 120. (Round your answer to the nearest whole number percent.

  Forecasting with time series analysis objective crusty

forecasting with time series analysis objective crusty pizza executives have to forecast december sales for the 10

Free Assignment Quote

Assured A++ Grade

Get guaranteed satisfaction & time on delivery in every assignment order you paid with us! We ensure premium quality solution document along with free turntin report!

All rights reserved! Copyrights ©2019-2020 ExpertsMind IT Educational Pvt Ltd