Reference no: EM131181505
Lab: Capturing Temperature Measurements with a Thermocouple
Procedure
1. With the Hewlett Packard E3631A DC power supply off connect two alligator leads from the power resistor terminals to the + and COM terminals (under ±25V label) as shown in Figure 5).
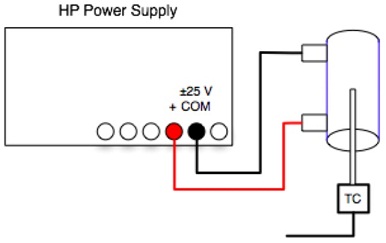
Figure 4. TC inserted into the core of the bower resistor (not to scale)
1. Start your temperature measurement VI. Within the NI software, set the thermocouple type to, ‘K' and set the units to ‘C'. Enable data logging in the NI software, collecting 1 sample/second.
2. Record the starting temperature as the ambient temperature, T∞, in the analysis discussion that follows.
3. Insert the Omega thermocouple into the center of the power resistor. The thermocouple should not touch the sides of the resistor, it must float at the center of the radius.
4. Set the power supply voltage to 16 V.
a. Turn on power supply by pressing the "Power" button. Press the "Output On/Off" button. Voltages are shown on the left half of the supply display, and currents on the right half. If a digit on the voltage side is not flashing, press the "Voltage/Current" button. Use the "Adjust" knob to set the voltage.
5. Observe the TC temperature as the resistor warms up to its maximum temperature, typically between 50 and 70°C (122 and 158°F). Collect data until dT/dt=0.0167, or one degree/minute, we will treat that as steady-state.
6. Remove the TC from the power resistor, hold it vertically without waiving it around and continue to measure the temperature until it returns to a value close to the ambient level. This is measuring the free convective cooling response of the thermocouple.
7. Stop your VI and save the data to a file.
8. Repeat this heating and cooling cycle two more times, saving the data into a new file each time.
9. Make sure you have three good cooling curves saved before you leave the lab.
These curves should generally look alike.
10. Turn off the power supply.
a. Press "Output On/Off" on the supply, and turn off "Power".
Your Report
Prepare a written report following the guidelines in our grading rubric. This report is due one week after your lab.
Required Graphical Results
Each of the three cooling curves should be included in the report
Some Discussion Points That Must Be Covered
• From your readings and lecture, what are some of the advantages and disadvantages of using the Cold Junction Compensation circuit for temperature measurement?
• Why would you choose a differential input channel thermocouple for this application rather than a single-ended channel?
• Explain your reasoning behind the setup of your voltage measurement task.
• What are some of the sources of measurement error in this experiment? What is the Omega Type K thermocouple temperature accuracy? Can you use propagation of error to estimate the error in the temperature readings?
• How well did the exponential cooling model fit the temperature data?
Required Printouts
• One page hardcopy of final temperature measurement front panel showing measured data for the three trials
• Excel, Labview, or Matlab analysis of your temperature measurements. Make sure all tables and figures are properly labeled in the body of your lab report or the appendix section.
• If you use Labview: one page hardcopy of final temperature measurement block diagram including the subVI. The diagram should have text documentation explaining the VI's function and the team member names.
|
Analyze type of challenge companies face in managing channel
: Analyze the types of challenges companies face in managing their channels and determine which is the most difficult to address. Explain your rationale.
|
|
Graph the fixed cost-variable cost
: Graph the fixed cost, variable cost and total cost curves. What is the average total cost when the output is 18n units per day?
|
|
Describe a health care provider with which you are familiar
: Describe a health care provider with which you are familiar and discuss the function and flows that needs to be performed by that provider's marketing channel. Provide specific examples to support your response.
|
|
Gross national product of economy
: i) Calculate the Gross National Product of this economy using the value added approach. ii) If depreciation and indirect taxes equal 8 billion and 7 billion shillings respectively, find the Net Domestic Product both at Market prices and at factor c..
|
|
Record the starting temperature as the ambient temperature
: Start your temperature measurement VI. Within the NI software, set the thermocouple type to, ‘K' and set the units to ‘C'. Record the starting temperature as the ambient temperature, T∞, in the analysis discussion that follows.
|
|
Communications planning process
: Communication Plan According to the PMBOK® Guide, "the Communications Planning process determines the information and communications needs of the stakeholders; for example, who needs what information, when they will need it, how it will be given to t..
|
|
Draw a set of cost curves including avc
: Draw a set of cost curves including AVC, ATC, and MC curves. Graphically show what will happen to these curves if technology improves, making it possible for the firm to use less labor.
|
|
Optimal order quantity given quantity discount information
: The Bellevue University bookstore purchases sweatshirts with the school name and logo from a vendor. The vendor sells the sweatshirts to the store for $38 per shirt. What is the bookstore;s optimal order quantity given this quantity discount informat..
|
|
How do you obtain most of your food
: How do you obtain most of your food? Does it come from a supermarket, or do you get some from a farmers' market or grow your own? Are you surprised to learn that less than 12 cents of a dollar spent on food goes to the primary sector, where the fo..
|