Random sample of tenures taken from a population

Assignment Help Basic Statistics
Reference no: EM131817775

A New York Times article entitled "How Long is Too Long for the Court's Justices?" reported in 2005 that the average Supreme Court justice between 1789 and 1970 served for 15.2 years. More recently, tenures tended to be longer, with the following times for the 9 justices serving in the first half of 2005:

1270_How Long is Too Long for the Court Justices.png

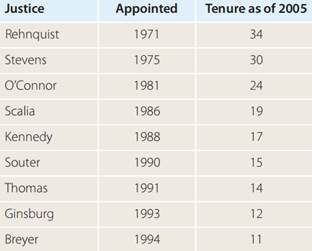
a. The mean tenure (in years) was 19.6 and the standard deviation was 8.1. Find the standardized tenure score, if these 9 were a random sample of tenures taken from a population with mean 15.2.

b. Explain why the standardized score should be written t and not z.

c. What information would be needed if we want to report a z statistic for the standardized score?

d. For 8 degrees of freedom, the probability of a t score being greater than 1.86 is 0.05. Explain why we cannot reject the hypothesis that these 9 tenures constitute a random sample from a population with mean 15.2.

e. By the second half of 2005, Rehnquist died and was replaced by Roberts; O'Connor retired, and was replaced in early 2006 by Alito. Explain why the new sample mean tenure, 14.0, could not be used as convincing evidence that tenure times averaged significantly longer than 15.2 years.

Reference no: EM131817775

Questions Cloud

Use and satisfaction by prelingually deafened adults : a. Construct a stemplot of the data to verify that the shape is roughly normal.
Describe why operational and financial metrics : describe why operational and financial metrics are important for managers to both understand and utilize.
Would you have managed this conflict in a different way : Describe a conflict that you have experienced in your professional life. After reading this material, would you have managed this conflict in a different way?
Compute the cost of the machining department : The Machining Department data that follow pertain to job no. 243, the only job in production at year-end. Compute the cost of the Machining Department
Random sample of tenures taken from a population : The mean tenure (in years) was 19.6 and the standard deviation was 8.1. Find the standardized tenure score, if these 9 were a random sample.
Reflecting your thoughts on partnering to heal : Create a journal entry of 200-250 words reflecting on your personal experiences or thoughts regarding the activities at these sites, the content
Determine the total cost to redecorate the mayor offices : Fine & Associates is an interior decorating firm in Tucson. Determine the total cost to redecorate the mayor's offices
What was his annual rate of return on this painting : What was his annual rate of return on this painting?
Size of a sample to test whether population : In this chapter, we learned to use the mean, standard deviation, and size of a sample to test whether population mean was actually different

Reviews

Write a Review

Basic Statistics Questions & Answers

  Calculate p-value for population of subscribers to golf

The publisher selects a random sample of 200 subscribers and finds that 116 plan to renew their subscriptions. Use (a=0.01). p = the population of subscribers to Golf Illustrated who renew. Calculate the p-value.

  Consider the following sample of seven chemical yields use

consider the following sample of seven chemical yields801814784836820901853use this sample to test that the population

  Determining acurate sample size

A "random survey" was conducted of 3274 people of the "microprocessor generation" (people born since 1971, the year the microprocessor were invented). It was reported that 48% of those

  The least squares prediction equation

SAS was used to fit the model E(y)  data points and the printout shown on page 573 was obtained

  They are now thermally connected by a reversible heat

a constant pressure pistoncylinder has 1 kg of saturated liquid water at 100kpa. a rigid tank contains air at 1200k

  Invest money in the stock market or in gold

Based on the expected return, would you rather invest your money in the stock market or in gold? Why?

  Find the mean variance and standard deviation

Suppose X is a hypergeometric random variable with sample size 8, population size 16, Find the mean, variance, and standard deviation of X

  Calculate the conditional distribution

Find the conditional distribution of T given that N = n. Calculate the conditional distribution of N, given that T = t, and notice that it is distributed as 1 plus a Poisson random variable with mean λ(1 - p)t.

  Differentiate between statistics and probability

Differentiate between statistics and probability with respect to what they deal with.

  Determining the class size and class level

Class size and class level. A university classifies its classes as either "small" (fewer than 40 students) or "large." A dean sees that 62% of Department.

  A may nromality of the sample proportion p be assumed b

in a hospital shipment of 3500 insulin syringes 14 were unusable due to defecta. is this sufficinet ecidence to reject

  Describe the sampling design and the method of analysis

Read one of the following articles or another research article in which a categorical data analysis is performed on data from a complex survey.

Free Assignment Quote

Assured A++ Grade

Get guaranteed satisfaction & time on delivery in every assignment order you paid with us! We ensure premium quality solution document along with free turntin report!

All rights reserved! Copyrights ©2019-2020 ExpertsMind IT Educational Pvt Ltd