Reference no: EM13372461
Question:
The diagram below illustrates a firm under monopolistic competition
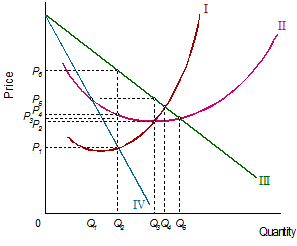
(a) Label the following curves: Curve I, Curve II, Curve III, Curve IV
(b) Does the diagram represent the short-run or long-run position?
(c) Is P3 the long-run equilibrium price? Explain your answer.
(d) What are the profit maximising output and price?
(e) On the diagram, shade in the amount of profit made at the maximum-profit output.
(f) Draw new average and marginal revenue curves on the diagram to illustrate the long-run equilibrium that will occur after the entry of new firms into the industry
(g) Explain the relationship between the AC, MC, AR and MR curves at this long-run equilibrium position?