Question 1a the x and y components of fluid velocity in a

Assignment Help Applied Statistics
Reference no: EM13371436

Question 1

(a) The x and y components of fluid velocity in a two-dimensional flow field are u=x and v= -y respectively

(i) Determine the stream function and plot the streamlines ψ=1 and 2

(ii) If a uniformed flow defined by ψ=y is superimposed on the above flow, determine the stream function and the velocity potential for this combined flow.

(b)  Explain the meaning of:

i) vorticity

ii) irrotational flow

iii) streamline

iv) stream function

v) velocity potential

Question 2

(a)  Air with a free stream velocity of 40 ms-1 flows past a smooth plate which is 3 m wide and 10 m long in the flow direction. Assuming that air density is equal to 1.2 kg m-3 and kinematic viscosity is equal to 1.49 10-5 m2s-1, determine

(i) The shear stress acting by the flow on the plate 6 m from the leading edge

(ii) The laminar sublayer thickness 6 m from the leading edge

(iii) The boundary layer thickness 6 m from the leading edge

(b) Explain the meaning of:

i) Reynolds stress tensor                                                                                                            

ii) Reynolds stress model

iii) averaged value                                                                                                         

iv) turbulent kinetic energy

Question 3

(a) All engineering CFD codes are focused on the solution of the following general equation

1677_Determine the stream function and plot the streamlines.png

Simplify this equation assuming that all parameters change in one direction only, do not explicitly depend on time and assume that the source term is equal to zero

(b) Discretise the expression for the second derivative using the finite difference approach

(c) Discretise the following equation using the finite volume approach

1355_Determine the stream function and plot the streamlines1.png

Question 4

The steady one-dimensional convection and diffusion equation can be presented in the form:

1058_Determine the stream function and plot the streamlines2.png

a) Discretise this equation using the central differencing finite volume approach

b) Discretise this equation using the upwind finite volume approach assuming that u is negative

c) Describe the range of applicability of the upwind approach

Question 5

(a)  An air stream with velocity 500 ms-1, static pressure 60 kN m-2 and temperature -18 °C undergoes a normal shock. Determine:

(i)  static pressure after the wave

(ii) stagnation pressure after the wave

(iii) air velocity after the wave

(NOTE: γ=1.4; R=287 J kg-1 K-1)

You may use the following relations without deriving it for the relations between Ma1 and  Ma2 and Ρ1  and Ρ2 
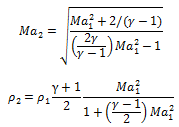
1116_Determine the stream function and plot the streamlines3.png

     (b)  Explain the meaning of:

       i) compressibility factor

       ii) continuity equation for normal shock waves

       iii) shock strength

Question 6

(a)  Starting with the Euler equation, derive the Bernoulli's equation for compressible flows

(b)  A venturi meter which has a throat diameter of 25 mm is installed in horizontal pipeline of 75 mm diameter conveying air. The absolute pressure at the inlet to the meter is 133.3 kPa and that at the throat is 100 kPa. Temperature of the air at the inlet 15 °C. Assuming isentropic flow determine the mass flow rate of air.

Reference no: EM13371436

Questions Cloud

A conducting sphere of radius r at potential zero is : a conducting sphere of radius r at potential zero is surrounded by a concentric spherical shell of dielectric material
Question 1the average annual salary for all us teachers is : question 1.the average annual salary for all u.s. teachers is 29863. assume that the distribution is normal and the
Mr smith is 60 years old he was diagnosed with prostate : mr. smith is 60 years old. he was diagnosed with prostate cancer five years ago. over the past few days mr. smith has
Section-a1 why is aggregate planning in produce-to-order : section-a1. why is aggregate planning in produce-to-order firms difficult?nbsp what can operations managers do to
Question 1a the x and y components of fluid velocity in a : question 1a the x and y components of fluid velocity in a two-dimensional flow field are ux and v -y respectivelyi
1 find the equation of the regression line for the given : 1. find the equation of the regression line for the given data.nbsp what is the predicted value of y when x -2?nbsp
Question 1nbsp calculating a z-score and graphing a box : question 1nbsp calculating a z-score and graphing a box plotnbsplook at the data under dietarysupp.nbsp the table gives
Part-1ques1what are the four types of training objectives : part-1ques.1what are the four types of training objectives? why is it necessary to formulate objectives for all four
Conceptual questionswhat is the difference between : conceptual questionswhat is the difference between descriptive and inferential statistics?what are the five

Reviews

Write a Review

Applied Statistics Questions & Answers

  Hypothesis testing

What assumptions about the number of pedestrians passing the location in an hour are necessary for your hypothesis test to be valid?

  Calculate the maximum reduction in the standard deviation

Calculate the maximum reduction in the standard deviation

  Calculate the expected value, variance, and standard deviati

Calculate the expected value, variance, and standard deviation of the total income

  Determine the impact of social media use on student learning

Research paper examines determine the impact of social media use on student learning.

  Unemployment survey

Find a statistics study on Unemployment and explain the five-step process of the study.

  Statistical studies

Locate the original poll, summarize the poling procedure (background on how information was gathered), the sample surveyed.

  Evaluate the expected value of the total number of sales

Evaluate the expected value of the total number of sales

  Statistic project

Identify sample, population, sampling frame (if applicable), and response rate (if applicable). Describe sampling technique (if applicable) or experimental design

  Simple data analysis and comparison

Write a report on simple data analysis and comparison.

  Analyze the processed data in statistical survey

Analyze the processed data in Statistical survey.

  What is the probability

Find the probability of given case.

  Frequency distribution

Accepting Manipulation or Manipulating

Free Assignment Quote

Assured A++ Grade

Get guaranteed satisfaction & time on delivery in every assignment order you paid with us! We ensure premium quality solution document along with free turntin report!

All rights reserved! Copyrights ©2019-2020 ExpertsMind IT Educational Pvt Ltd