Provide summary for the observed data

Assignment Help Applied Statistics
Reference no: EM132352293

Assignment -

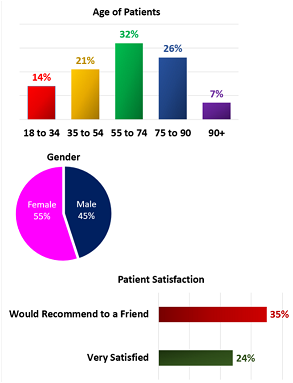
Patient Outcomes - You work for a regional healthcare system and have been recently promoted into an executive position in which you have some administrative and financial responsibilities over additional departments including an outpatient surgery center. As part of your onboarding and assessment of the new surgery center, you've discovered that few analytics on the surgery center's operations and profitability are available. However, you were able to obtain some anonymized patient survey data that has been randomly sampled over the last several weeks. The data includes information on procedures and their outcomes, as well as some patient demographics, satisfaction and profitability. You also received a copy of last year's internal annual report that included the following infographics on patients:

273_figure.png

Use this data to build a managerial summary outlining your findings and recommendations. Your analysis should answer all of the following questions and should have the outputs of the graphs or the statistical tests being used:

1. Provide summary for the observed data (FinalProject.xlsx) that is comparable to expected data from last year's internal annual report.

2. Do the gender and age range distributions in the sample data match your expectations from the infographics in the annual report? If not, which demographic groups seem to be either over- or under-represented?

3. Is a patient's likelihood to recommend the surgery center tied to their satisfaction level? Is it reasonable to expect that a program designed to increase patient satisfaction would be likely to result in more patient recommendations?

4. Is the average patient profitability (lifetime value) the same for the different procedures offered by the center? If not, which procedures have significantly higher or lower patient lifetime values compared to others?

5. Your managerial summary should include a description of the statistical tests used to answer each question, the necessary results for each test (test statistics, p-values, etc.) and should show that any required assumptions for those tests are valid.

Note - Please answer all the questions mentioned above.

Attachment:- Biostatistics Assignment Files.rar

Reference no: EM132352293

Questions Cloud

Evaluate the success of harmonisation : "Discuss and critically evaluate the success of harmonisation. Choose a country as an example for illustration on how it has adopted IFRS in its attempt.
Six myths and realities of team work : Wright discussed the six myths and realities of team work. Briefly, explain each myth and provide a short personal thought of the myth bounced against reality.
Identify the industry market structure : Identify this industry's market structure and at least two or more market characteristics that support this market structure. (Market structures are covered).
Does the author highlight the primary objective : Does the author highlight the primary objective of this? paper? Explain your answer.
Provide summary for the observed data : Provide summary for the observed data (FinalProject.xlsx) that is comparable to expected data from last year's internal annual report
What is the role of intuition in decision making : Should managers use more objective or subjective intuition techniques when making decisions? Please explain your answer.
What are the key elements that should be considered : 1. What are the key elements that should be considered during research and writing process.
What is the big data gap : What is the Big Data Gap? What in your opinion should be done to fill the gap?
Why social contacts are important and should be encouraged : Support Families in Maintaining Relationships in their Wider Social Structures-K/601/9185-xplain why social contacts are important and should be encouraged.

Reviews

Write a Review

Applied Statistics Questions & Answers

  Calculate the maximum reduction in the standard deviation

Calculate the maximum reduction in the standard deviation

  Determine the minimum variance portfolio

Directions: Update the data with your recommendations for the blue cells, then use Solver to determine the minimum variance portfolio. Choose the index for each asset class, type the name below and paste in the relevant returns

  Given a business situation word problem

Given a business situation word problem or case study such as one dealing with processing time or quantity of fill, use the normal probability distribution to determine a course of action.

  Calculate standard error of the mean

Calculate standard error of the mean. Calculate the margin of error at an 80% confidence level. Calculate the confidence interval at an 80% confidence level.

  What is the name for this characteristic of the test

You have to use "R Software". Use the model to classify the subjects into predicted outcomes using a 0.5 cutoff. What is name for this characteristic of test

  Run a hypothesis test to test whether the population

In a simple random sample of 36 families in a certain country, you find that sample mean income to be $9,500 with a sample standard deviation of $2,500.  Run a hypothesis test (α=.05) to test whether the population's mean exceeds $9,000.  What is the..

  Probability that at least one of the eggs is contaminated

If Salmonella contamination occurs independently in egg cartons, and we should make a "three-egg omelet", what is the probability that at least one of the eggs is contaminated with Salmonella?

  Calculate the geometric rate of return for the djia

Calculate the geometric rate of return for the DJIA from 2005 to 2010. If an investment of $100,000 is made in 2005 and the portfolio performs with returns equal to those of the DJIA, what is the investment worth in 2010?

  What is the approximate percentage of first year graduates

401077 Introductions to Biostatistics Autumn 2017 Assignment. Last year's graduates from an MPH degree, had a mean first-year income of $62,000 with a standard deviation of $8000. These first year salary levels are known to be normally distributed..

  What is the approximate minimum percentage of data

What is the approximate minimum percentage of data in any frequency distribution that lies within 3 standard deviations of its mean?

  Construct a relative frequency histogram for CSR

ACC 707 Auditing and Assurance Services - Construct a relative frequency histogram for CSR and a frequency polygon for SFR on the same graph with equal class

  What is the probability of a randomly selected resident

A) What is the probability of a randomly selected resident being in favor of the bridge?B) What is the probability that a randomly selected resident is a woman and is Opposed to the bridge?C) What is the probability of a randomly selected resident be..

Free Assignment Quote

Assured A++ Grade

Get guaranteed satisfaction & time on delivery in every assignment order you paid with us! We ensure premium quality solution document along with free turntin report!

All rights reserved! Copyrights ©2019-2020 ExpertsMind IT Educational Pvt Ltd