Reference no: EM131369462
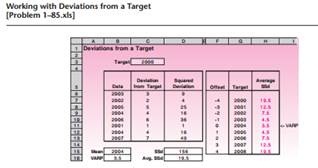
To calculate variance and standard deviation, we take the deviations from the mean. At times, we need to consider the deviations from a target value rather than the mean. Consider the case of a machine that bottles cola into 2-liter (2,000- cm3) bottles. The target is thus 2,000 cm3. The machine, however, may be bottling 2,004 cm3 on average into every bottle. Call this 2,004 cm3 the process mean. The damage from process errors is determined by the deviations from the target rather than from the process mean. The variance, though, is calculated with deviations from the process mean, and therefore is not a measure of the damage. Suppose we want to calculate a new variance using deviations from the target value. Let "SSD(Target)" denote the sum of the squared deviations from the target.
[For example, SSD(2,000) denotes the sum of squared deviations when the deviations are taken from 2,000.] Dividing the SSD by the number of data points gives the Average SSD(Target). The following spreadsheet is set up to calculate the deviations from the target, SSD(Target), and the Average SSD(Target). Column B contains the data, showing a process mean of 2,004. (Strictly speaking, this would be sample data. But to simplify matters, let us assume that this is population data.) Note that the population variance (VARP) is 3.5 and the Average SSD(2,000) is 19.5. In the range G5:H13, a table has been created to see the effect of changing the target on Average SSD(Target). The offset refers to the difference between the target and the process mean
1. Study the table and find an equation that relates the Average SSD to VARP and the Offset. [Hint: Note that while calculating SSD, the deviations are squared, so think in squares.]
2. Using the equation you found in part 1, prove that the Average SSD(Target) is minimized when the target equals the process mean.
|
Download the data on the cumulative number of aids cases
: Download the data on the cumulative number of AIDS cases reported in the United States and its age-range breakdown. Draw a pie chart of the data.
|
|
Market structure classification of the apple iphone 6 plus
: For this assignment you are to write a 1 to 2-page paper that addresses market structure classification of the Apple iPhone 6 plus. Note: The Apple iPhone 6 plus cellular phone will be researched for each course project assignment leading up to y..
|
|
Make a comparison time plot of the cpi data
: Go to the Average Price Data area and get a table of the last 48 months' average price of unleaded regular gasoline. Make a comparison time plot of the CPI data in part 1 and the gasoline price data. Comment on the gasoline prices.
|
|
What are the benefits of integrating market research
: What are the benefits of integrating market research findings into planning for quality service? Although the key indicator of Japanese marketing success in the motor vehicle manufacturing and other industries is their customer focus, there are oth..
|
|
Prove that the average ssd is minimized
: Study the table and find an equation that relates the Average SSD to VARP and the Offset.- Using the equation you found in part 1, prove that the Average SSD(Target) is minimized when the target equals the process mean.
|
|
Can the government run the economy
: Write a summary of the video and tell us your overall agreement/disagreement with the ideas presented. Explain and support your thoughts.
|
|
Describing the effect of each transaction on assets
: Prepare a tabular analysis that shows the effects of these transactions on the expanded accounting equation, similar to that shown in Illustration 3-3.
|
|
Justifies a competition classification for the industry
: Commercial Airlines Industry Justifies a competition classification for the industry. Describes the size and strength of current key firms in the industry, as these determine ease of entry and exit for new entrants into the market.
|
|
Calculate mean and standard deviation of the stock prices
: Calculate the mean and the standard deviation of the stock prices.- Get the corresponding data for Kmart and calculate the mean and the standard deviation.
|