Reference no: EM132592986
SC1102 Modelling Natural Systems - James Cook University
Open the file: Old Faithful Geyser.xlsx This file contains data on38 randomly selected eruptions of the Old Faithful Geyser (Figure 1), a popular attraction in Yellowstone National Park. The Old Faithful Geyser is recognized by many geologists as the most predictable geographical feature on Earth.
Row 2 of this excel file (Figure 2) shows that this eruption lasted 267 seconds in duration and reached a height of 140 feet. The next eruption occurred 104 minutes later.
This example considers eruptions that lasted for more than 200 seconds in duration. Records exist where the duration time is much quicker.
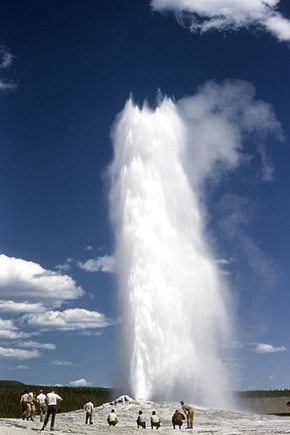
Figure 1: An eruption of the Old Faithful Geyser
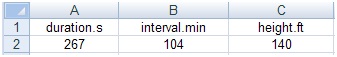
Figure 2: first two rows in the spreadsheet Old Faithful Geyser.xlsx
Exercise 1:
a) Produce a frequency histogram for the data in column A.
b) Interpret key features of this histogram. (Hint: Don't take a microscope to the histogram and discuss every lump and bump, discuss the most notablefeatures in the histogram.Trust your instincts - usually your first reaction to the graph is the most notable feature. Once sentence should be enough)
Hints: for producing good graphs in excel. Maximise the data to ink ratio by
1. removing redundant white space: your graph is a piece of real estate, make the most of every pixel
2. remove unnecessary borders, backgrounds, redundant labels, special effects, bolding and remove gridlines.
3. Try lightening labels
4. Black and white is ‘alright'. Use colour only as a ‘weapon' to highlight key features.
Exercise 2: Using the data in column A, calculate the
a) mean ________________________ [1]
b) median ______________________ [1]
c) standard deviation ___________________ [1]
d) quartiles _________________________ [1]
e) interquartile range_____________________[1]
(Hint: write the units of duration in each answer ato e. Markers will penalize assessment quite heavily when the units are incorrect or not given).
Exercise 3:
a) Produce an appropriate plot to visualize the relationship between the interval (y) and the duration (x). [2]
b) Write the equation for the line of best fit for the interval (y) and the duration (x). _____________________________________ [1]
c) Compute the correlation between the interval (y) and the duration (x). _________
d) Interpret your findings.
|
Apple is organisation with vast global operations
: Apple is an organisation with vast global operations. As Apple's new innovation management consultant, use published sources such as journal articles,
|
|
Decrease in the supply of loanable funds
: Why is it likely that in the next 10 to 15 years there will be a decrease in the supply of loanable funds?
|
|
Calculate consumer surplus
: Let demand for notebook paper be given by Q = 50 - 5P, while supply is given by Q = 5P.
|
|
Determine what should be reported in the statement
: Determine What should be reported in the statement of financial position as carrying amount of patent on December 31, 2010?
|
|
Produce a frequency histogram for the data
: Produce a frequency histogram for the data - remove unnecessary borders, backgrounds, redundant labels, special effects, bolding and remove gridlines
|
|
Marginal rate of technical substitution
: Peter is studying for an exam. There are two "inputs" to the grade he receives: hours per week spent working on problem sets
|
|
Journalize the adjusting entries at march
: Journalize the adjusting entries at March 31 on the books of Corona Video Company. March bank service charge not recorded by the depositor $56.
|
|
What should be reported in statement of financial position
: On January 1, 2007, What should be reported in the statement of financial position as carrying amount of patent on December 31, 2010?
|
|
Notion of sustainability in the context of environment
: What is the notion of sustainability in the context of environment? Has inequality any effect on sustainability? Please clarify.
|