Reference no: EM131475381
Part A: Equity Chart
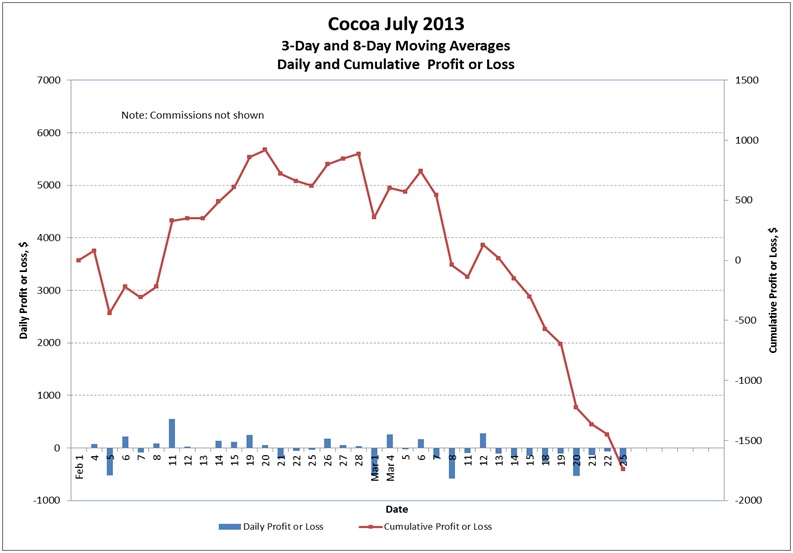
Produce a chart of daily profit or loss and of the account equity. Do not include commissions as a series. To do this, highlight the data in the DailyProfit or Loss and Cum. Profit or Loss columns. Click on the Insert tab and choose clustered column chart.Right click on the embedded chart that forms and move the chart to a new page. Rename the tab of the chart page to EquityChart.
The chart produced must be modified extensively.
- Convert the column chart for the cumulative profit and loss to a line graph. To do this click on the series, use Chart tools/Design/Change Chart Type to line chart with markers. Reduce the size of the markers.
- Name the two series and add the dates for the x-axis. Right click anywhere on the chart and choose Select Data. Select each series and edit it. Edit the Horizontal (Category) Axis labels to insert the dates instead of just numbers.
- Move the legend to the bottom of the page without overlapping the chart.Stretch the legend so the two entries are not too close and so they are side by side instead of above and below each other. Remove the border from the legend.
- Put a border around the plot area.
- Make the gridlines dashed lines.
- No shading in the plot area.
- Use Chart Tools/Layout/Chart Title to give the chart a three-line title. See the example.
- Use "Date" as the primary horizontal axis title. Chart Tools/Layout/Axis Titles.
- Use "Daily Profit of Loss, Report Format
1. Cover page. Be sure the name of the contract is on the cover page.
2. Specifications of contract from the official exchange website.
3. Intra-day quotes for your contract from barchart.com.
4. The display of data.
6. The price chart. Use the same scales as the other analysts.
7. The equity chart. Use the same scales as the other analysts.
8. Cell formulas. Be sure to include border row and column headings and gridlines.
9. Margin data from tradestation.com for your contract.
10. The returns on margin table.
11. Conclusion
quot; as the label for the primary vertical axis, rotated. Chart Tools/Layout/Axis Titles.
- Assign the cumulative profit or loss to the right vertical axis. Click on the series and choose Secondary Axis under Format Data Series. This usually causes both axes to have different scales. Set both axes to have the same scales. Everybody using the contract should use the same scales.
- If you use different scales on the two axes, make the scales multiples of each other. That should cause them to line up on the gridlines.Also, you will have to manually set the scales, tick sizes, etc. so that the X axis passes through 0 on both axes.
- Use "Cumulative Profit or Loss, Report Format
1. Cover page. Be sure the name of the contract is on the cover page.
2. Specifications of contract from the official exchange website.
3. Intra-day quotes for your contract from barchart.com.
4. The display of data.
6. The price chart. Use the same scales as the other analysts.
7. The equity chart. Use the same scales as the other analysts.
8. Cell formulas. Be sure to include border row and column headings and gridlines.
9. Margin data from tradestation.com for your contract.
10. The returns on margin table.
11. Conclusion
quot; as the label for the secondary vertical axis, rotated.
- Make sure the gridlines match up with tick marks on both Y axes. The gridlines are actually attached to the left Y axis.
- Add a text box (Chart Tools/Layout/Text Box) to the chart somewhere with the message:
"Note: Commissions not shown." in 10-pt font.
Include the display of data corrected from Assignment #2, the price chart again (corrected as needed), and the chart of daily and cumulative profits and losses. Do not submit the spreadsheet itself.

Part B: Final Report
First you will need to find and document the initial margin required for your contract.
So theinitial margin for cocoa is $1,595 per contract in 2017. In the example below, I used $880 as the initial margin for a 2013 futures contract. Many futures brokers will provide this information.
You can also get the information from the appropriate exchange.
Report Format
1. Cover page. Be sure the name of the contract is on the cover page.
2. Specifications of contract from the official exchange website.
3. Intra-day quotes for your contract from barchart.com.
4. The display of data.
6. The price chart. Use the same scales as the other analysts.
7. The equity chart. Use the same scales as the other analysts.
8. Cell formulas. Be sure to include border row and column headings and gridlines.
9. Margin data from tradestation.com for your contract.
10. The returns on margin table.
11. Conclusion
Attachment:- Final report.rar