Reference no: EM132397188
Part A - Subcatchment Storage Routing
Consider a hypothetical subcatchment area of 15 km2 and 1 in 100 AEP, 60 minute design storm data for the subcatchment is provided in Table 2.1 below.
Table 2.1 Design storm data (1 in 100 AEP, 60 minute)
|
Time period at
6-minute intervals
|
6-minute rainfall
intensity (mm/hour)
|
|
1
|
29.3
|
|
2
|
46.8
|
|
3
|
53.2
|
|
4
|
71.4
|
|
5
|
42.8
|
|
6
|
22.6
|
|
7
|
18.7
|
|
8
|
39.5
|
|
9
|
21.8
|
|
10
|
15.4
|
The initial and continuing loss (IL-CL) data across Australia is discussed in the ARR 2016 Book 5 - Flood Hydrograph Estimation (Ch 3 Losses). The recommended IL (mm) and CL (mm/hour) value across Australia can be found in Figure 5.3.18 and Figure 5.3.19, respectively in ARR 2016. Consider that the subcatchment is located in Brisbane and the recommended IL is 20 mm and CL is 2 mm/hour. Using the 6-minute rainfall data provided in Table 2.1, catchment area of 15 km2, and the recommended IL = 20 mm and CL = 2 mm/hour, you need to perform the following tasks:
Provide a table (as shown below) showing the 6-minute rainfall depths (mm), cumulative rainfall (mm), IL or CL applies, 6-minute rainfall excess depths (mm) using the recommended IL-CL values and 6-minute rainfall excess intensity (mm/hour).
|
Time period at 6-minute intervals
|
6-minute rainfall intensity (mm/hour)
|
6-minute rainfall depths (mm
|
Cumulative rainfall (mm)
|
IL or CL
applies?
|
6-
minute rainfall excess
depths (mm)
|
6-minute rainfall excess intensity (mm/hour)
|
|
|
|
|
|
|
|
|
Convert the 6-minute rainfall excess hyetograph to a subcatchment instantaneous discharge hydrograph (in m3/s) using Equation 6.1 provided in the Study Book (section 6.3.2, page 14). You need to provide:
A table showing the 6-minute rainfall excess intensity (mm/h) and subcatchment instantaneous discharge (m3/s), and
A figure showing the rainfall excess hyetograph (time step vs rainfall depth ) and the instantaneous hydrograph (time step vs discharge).
Perform a subcatchment storage routing using Equations 6.2 - 6.8 provided in the Study Book (section 6.3.3, pages 16-18). You may assume that at the beginning of storm (time is zero) both storage and subcatchment outlet discharge are zero. You need to provide:
A look-up table showing the relation between discharge (Q in m3/s), storage (S in m3) and [2S/Δt + Q] in m3/s,
A table showing your subcatchment routing estimation as shown in Table 6.7 (Study Book),
A figure showing the inflow (instantaneous) and subcatchment outlet hydrographs, and
Report the attenuation (reduction of peak in m3/s) and translation (lag in time unit).
Part B - Minor and Major Design Discharges
Proposed residential subdivision
A drainage scheme is to be designed for a residential area located in Mackay, Queensland. A schematic subdivision layout plan is shown in Figure 3.1. The reduced levels (elevation) at different points in the subdivision are shown in Table 3.1. The subdivision includes six lots (A, B, C, D, E and F) as shown in Figure 3.1. After development, the fraction impervious of the lots will be 0.3. A 10 m wide new road will be constructed in a 20 m wide road reserve. The road crossfall is 1:40 [vertical 1, horizontal 40] two-way. The road will have a 200 mm high vertical kerb and a 0.45 m wide gutter having a crossfall of 1:10. The drainage scheme includes six on-grade Pits (1 to 6) as shown in Figure 3.1. Pits and their catchments are provided in Table 2.2.
Your task is to prepare a Minor system design check of the stormwater system upstream and including Pit 4 (Pits 1 to 4) based on the preliminary layout shown in Figure 3.1 and then a Major flood hazard check in the road just downstream of Pit 4. The Minor system is to cater for the 2 year ARI (50% AEP) storm and the Major system for the 100 year ARI (1% AEP) storm. The system includes drainage pipes (Pipe 1-2, Pipe 2-4, Pipe 3-4, Pipe 4-6 and Pipe 5-6).
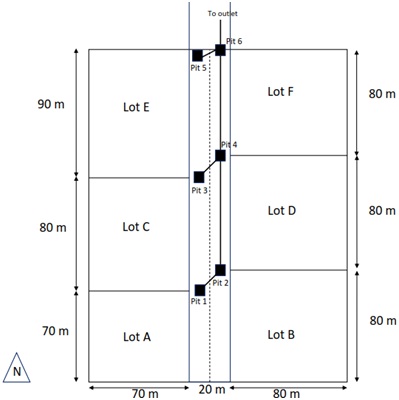
Figure 3.1: Preliminary layout of stormwater drainage system in a residential subdivision Table 3.1: Reduced levels at different points in the subdivision
Table 3.2 Catchment areas for Pits within the subdivision
|
Location
|
Reduced Level (m Local Datum)
|
|
Lot B/south-east corner
|
53
|
|
Lot B/north-west corner
|
50
|
|
Pit 2 surface level
|
49.5
|
|
Lot D/ south-east corner
|
51
|
|
Lot D / north-west corner
|
48
|
|
Pit 4 surface level
|
47.6
|
|
Lot F / south-east corner
|
47
|
|
Lot F / north-west corner
|
45
|
|
Pit 6 surface level
|
44.6
|
|
Lot A / south-west corner
|
52
|
|
Lot A / north-east corner
|
50
|
|
Pit 1 surface level
|
49.6
|
|
Lot C / south-west corner
|
50.5
|
|
Lot C / north-east corner
|
47.8
|
|
Pit 3 surface level
|
47.7
|
|
Lot E / south-west corner
|
48.2
|
|
Lot E / north-east corner
|
45.5
|
|
Pit 5 surface level
|
45
|
Table 3.2 Catchment areas for Pits within the subdivision
|
Pit
|
Contributing area
|
|
Pit 1
|
Lot A
Half width of road adjacent to Lot A (south end to Pit 1)
|
|
Pit 2
|
Lot B
Half width of road adjacent to Lot B (south end to Pit 2)
|
|
Pit 3
|
Lot C
Half width of road adjacent to Lot C (Pit 1 to Pit 3)
|
|
Pit 4
|
Lot D
Half width of road adjacent to Lot D (Pit 2 to Pit 4)
|
|
Pit 5
|
Lot E
Half width of road adjacent to Lot E (Pit 3 to Pit 5)
|
|
Pit 6
|
Lot F
Half width of road adjacent to Lot F (Pit 4 to Pit 6)
|
Part C - Feasibility Study of a Proposed Water Supply Dam (Yield Analysis)
In order to augment the water supply in the Toowoomba region, a proposal has been submitted to construct a dam [10 m height, 20 m long and holds 100 ML of water when full] on the Gowrie Creek at Cranley [site number 422326A]. When full, surface area of the reservoir is 500 m2. A preliminary feasibility study is required to justify this plan. Therefore, you are requested to perform a daily yield analysis for the year 2017 (365 days). As a preliminary feasibility study, you are requested to estimate a constant daily water demand (in ML/day) that can be diverted (or extracted) from the reservoir with a reliability of 80%.
You can download the Gowrie creek at Cranley (422326A ) daily streamflow volume (megalitre/day) from the water monitoring portal.
Consider the BOM rainfall station 041529 (Toowoomba Airport QLD) for this preliminary yield analysis. You can download the daily rainfall data from.
The average pan evaporation data is provided below in Table 4.1. You can consider a constant daily evaporation rate for all the days in a month. A pan coefficient of 0.8 is applicable.
Table 4.1: Pan Evaporation data (mm/day)
|
Month
|
Pan Evaporation
(mm/day)
|
|
Jan
|
6.7
|
|
Feb
|
5.8
|
|
Mar
|
5.0
|
|
Apr
|
4.0
|
|
May
|
2.7
|
|
Jun
|
2.2
|
|
July
|
1.7
|
|
Aug
|
3.7
|
|
Sep
|
5.0
|
|
Oct
|
5.8
|
|
Nov
|
7.0
|
|
Dec
|
7.3
|
On 31st December 2016, storage volume in the dam was 27 ML.
Ignore seepage losses for this preliminary feasibility study.
Neglect the change in surface area with storage height/volume and you may consider a constant surface area of 500 m2 for all the cases in this preliminary assessment.
Table 8.5 in the Study Desk (Mod 8 Table 8.5 in the ENV3105StudyResources.xlsx) can be used to solve this yield analysis
Apply the trial and error method to estimate the diverted water (demand) at 80% reliability.
Attachment:- Subcatchment Storage Routing.rar