Reference no: EM131682151
- Read the short case below and answer the 8 questions follow.
- All work must be shown/explained when a calculation is required. Zero credit if work is not shown. Zero credit will be given for the distribution graph if it is not properly labeled and formatted.
- Due dates (Note: late assignments will have 10 points deducted from the final score):
- No partial credit will be provided on any question. Either the answer is correct or incorrect.
- Clearly indicate your final answer on your submission.
- Attach any spreadsheets, etc. as needed to support your analysis and show your work.
"85 mph speed limits could hit some Michigan highways under new House proposal" by Jonathan Meever - Mlive Media Group, July2017.
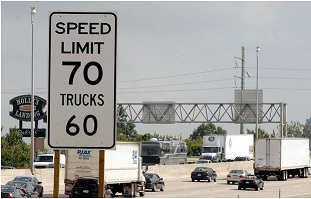
(MLive file photo)
LANSING, MI -- Speed limits could reach 85 miles per hour on "rural" freeways under legislation introduced this year in the Michigan House for possible consideration. The five-bill package, similar to measures introduced in the Senate earlier this year, would give the Michigan Department of Transportation and Michigan State Police the authority to set higher speed limits based on scientific studies of typical traffic flow.
"People drive as fast as they feel safe," according to sponsoring state Rep. Bradford Jacobsen, R-Oxford, who said studies show that a majority of Michigan residents are already traveling at speeds well above the current 70 mph limit for highways.
"We're almost driving 85 mph anyways, so why should we make people lawbreakers when it could be considered a reasonable speed?" Jacobsen said.
The proposed legislation would follow the "85th percentile" rule, meaning limits would generally be established to reflect the average speed at which 85 percent of motorists are already traveling safely.
MDOT and the MSP could designate "rural access freeways," and speed limits for those specific highways would be set at 85 mph unless otherwise specified.
The term "rural" is loosely defined and fairly malleable, according to Jacobsen. He cited a stretch of US-127 between Jackson and Lansing as an example.
"That can be very rural and have very few ramps," he said. "It would make sense to have that at 85 mph, but this would leave it up to the state police to figure that out. We used the world 'rural' or out-state just to make sure people know we're not trying to change I-75 through downtown Detroit."
Traffic researchers say speed limits and safety are not always directly related. As Jacobsen noted, motorists tend to travel at speeds they feel safe, and uniform speeds tend to produce safer roads.
Critics point out that faster speeds can lead to deadlier crashes, but MDOT and MSP officials previously expressed support for setting limits based on the 85th percentile rule.
"There isn't any safety justification, in almost every instance, to set a limit below the 85th percentile," according to James C. Walker of the National Motorists Association, who said the proposed legislation would also serve to minimize unfair speed traps.
"When that does happen, it's about revenue or it's about responding to comments from citizens who don't understand the science. Some people operate under the sincere but mistaken belief that lower speed limits are always safer."
Other House bills tie-barred to the speed limit legislation would exclude speeding violations of 5 mph or less from a motorists' official driving record and update required signage rules in school zones.
The package was referred to the House Transportation and Infrastructure Committee. With only nine scheduled session days left on the calendar, the bills would have to speed through the Legislature to reach the governor's desk by the end of the year.
Jacobsen said he's received only one negative comment on his legislation - from a constituent, not a fellow lawmaker - and said the speed limit proposal has otherwise been well received.
"I don't think there's any major objections," he said. "It's just a matter of if we have time to get it done in lame duck. If that doesn't happen, we'll reintroduce it in January, but I really think we've got a good chance to get it done."
Summarized below are the current maximum interstate highway speed limits (mph) for automobiles in each of the 50 states:
Alabama 70 Alaska 65 Arizona 75
Arkansas 70 California 70 Colorado 75
Connecticut 65 Delaware 65 Florida 70
Georgia 70 Hawaii 60 Idaho 80
Illinois 70 Indiana 70 Iowa 70
Kansas 75 Kentucky 70 Louisiana 75
Maine 75 Maryland 65 Massachusetts 65
Michigan 70 Minnesota 70 Mississippi 70
Missouri 70 Montana 75 Nebraska 75
Nevada 75 New Hampshire 70 New Jersey 65
New Mexico 75 New York 65 North Carolina 70
North Dakota 75 Ohio 70 Oklahoma 75
Oregon 65 Pennsylvania 70 Rhode Island 65
South Carolina 70 South Dakota 80 Tennessee 70
Texas 85 Utah 80 Vermont 65
Virginia 70 Washington 75 West Virginia 70
Wisconsin 65 Wyoming 85
1. Calculate the mean speed limit for all 50 states based upon the above interstate highway speed limit data.
2. Calculate the median speed limit for all 50 states based upon the above interstate highway speed limit data.
3. Calculate the mode speed limit for all 50 states based upon the above interstate highway speed limit data.
4. Prepare a frequency distribution graph (not table) for the 50 data points above. The graph must be clearly labeled and professional in appearance. The "X" axis should be speed limits, and the "Y" axis should represent the number of states at each speed limit. For example, at 65 mph, the visual would show 11 states on the "Y" axis with that speed limit.
5. States in the Northeast Region include Connecticut, Maine, Massachusetts, New Hampshire, New Jersey, New York, Pennsylvania, Rhode Island and Vermont. States in the Southwest Region include Arizona, Nevada, New Mexico, Texas and Utah.How does the mean, median and the mode for the interstate highway speed limits compare between these two regions? Explain the conclusion to be drawn from this comparison.
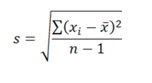
6. Sample data is listed below for each of the 50 states and the District of Columbia forthe percentage of adults age 21 and over that reported driving after drinking too much within the past 30 days. Use a total sample size of n=51 for the fifty states plus the District of Columbia.Calculate the sample standard deviation for the percentage of respondents reporting driving after drinking too much. Here is the standard deviation equation:
7. What is the range for the percentage of respondents reporting driving after drinking too much based upon the sample data below? Specify both the lowest value in the range and the highest value in the range, and the corresponding states having the lowest value and highest value in the range.
8. Calculate the confidence interval for the percentage of respondents reporting driving after drinking too much based upon the data below. Assume we want to be 95% confident with the estimate. Therefore, the Z value to ensure that one-half of the distribution from each side of the mean is included is 1.96. To complete this calculation you will use this equation:

Explain what this confidence interval means (Refer to the slides from class to help you).
|
Location
|
Driving After Drinking Too Much (past 30 days)
|
|
Alabama
|
1.7%
|
|
Alaska
|
1.2%
|
|
Arizona
|
1.7%
|
|
Arkansas
|
1.0%
|
|
California
|
1.8%
|
|
Colorado
|
1.9%
|
|
Connecticut
|
2.1%
|
|
Delaware
|
2.7%
|
|
District of Columbia
|
1.8%
|
|
Florida
|
2.1%
|
|
Georgia
|
1.4%
|
|
Hawaii
|
2.9%
|
|
Idaho
|
1.2%
|
|
Illinois
|
2.2%
|
|
Indiana
|
1.6%
|
|
Iowa
|
3.1%
|
|
Kansas
|
2.1%
|
|
Kentucky
|
1.5%
|
|
Louisiana
|
2.5%
|
|
Maine
|
1.2%
|
|
Maryland
|
2.1%
|
|
Massachusetts
|
2.2%
|
|
Michigan
|
1.9%
|
|
Minnesota
|
2.4%
|
|
Mississippi
|
1.2%
|
|
Missouri
|
1.8%
|
|
Montana
|
3.4%
|
|
Nebraska
|
3.4%
|
|
Nevada
|
1.8%
|
|
New Hampshire
|
1.4%
|
|
New Jersey
|
1.5%
|
|
New Mexico
|
1.2%
|
|
New York
|
1.4%
|
|
North Carolina
|
1.4%
|
|
North Dakota
|
3.3%
|
|
Ohio
|
2.2%
|
|
Oklahoma
|
1.8%
|
|
Oregon
|
1.4%
|
|
Pennsylvania
|
1.8%
|
|
Rhode Island
|
2.4%
|
|
South Carolina
|
1.6%
|
|
South Dakota
|
2.5%
|
|
Tennessee
|
1.1%
|
|
Texas
|
2.1%
|
|
Utah
|
0.7%
|
|
Vermont
|
1.8%
|
|
Virginia
|
1.4%
|
|
Washington
|
2.1%
|
|
West Virginia
|
0.7%
|
|
Wisconsin
|
3.1%
|