Predict the number of subscriptions for a month

Assignment Help Basic Statistics
Reference no: EM13854961

1. Describe the overall pattern of the relationship between hours spent telemarketing and number of new subscriptions.

2. What is the correlation between hours spent telemarketing and number of new subscriptions? [numerical answer required]

3. What is the equation for the least squares regression line for the relationship between hours spent telemarketing and number of new subscriptions?
[Note: The OLI materials give the equation in the form Y = a + bx
But Excel presents the equation as Y = bx + a.
It doesn't matter which way you express it as long as it's correct and you can distinguish between the intercept and the slope.]

4. If telemarketing hours increase by one hour, we would expect the number of new subscriptions to _________ by ____________.

5. Predict the number of subscriptions for a month in which there were 905 hours of telemarketing.

6. Explain why it would not be a good idea to predict the number of subscriptions for a month in which there were 1600 hours of telemarketing.

7. A researcher found that the relationship between the appraised value of a house (in thousands of dollars) and its age (in years) could be summarized by the regression equation:

Appraised value = 400.8 - 2.5 * age.

Interpret the value of the slope in the context of this study.

The attached data file (Magazines.2015.xls) contains the hours per month spent telemarketing and the number of new subscriptions per month over a two-year period for a magazine publisher. The publisher would like to predict the number of new subscriptions based on the hours spent telemarketing.

Use the data to create a scatterplot; add a trendline; request the regression line equation and the r-squared value. (You do not have

to submit the scatterplot but you will need it to answer Questions 1 - 6 below.)

HINT: Make sure the explanatory variable is on the x-axis.

8. An investor asks: How are stock prices influenced by interest rates?

Identify the explanatory and response variables.

9. The graph below shows the relationship between average daily temperature and the amount of ice cream sales at an ice cream stand.

995_78.png

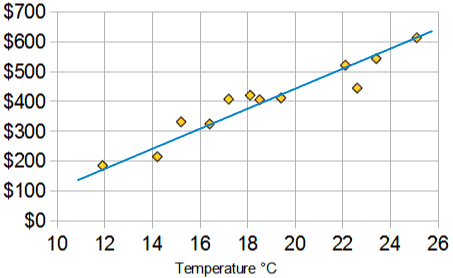
Based on the graph, what is the best prediction for the amount of ice cream sales on a day when the average temperature is 200C?


10. In New York State there is a fairly strong positive correlation between principals' salaries and the reading scores of their students. (This is true.) Upon learning this, a politician recommends that principals' salaries be increased because this will cause students' reading scores to increase. Good idea? (Use your knowledge of statistics to explain your answer.)


Attachment:- magazines.2015.xls


Reference no: EM13854961

Questions Cloud

Describe an interpersonal conflict you have had : Describe an interpersonal conflict you have had. What was it about? How did you resolve it? What is the relationship like now with this person?
Describe the segments for a childrens clothing store : You have been asked to identify various segments in the market and then a potential targeting strategy. Describe the segments for a children's clothing store, and then justify the best targeting strategy to use.
Present the issue and necessary thesis statement : What are the main arguments and What is the point of this book or article? What topics are covered? If someone asked what this article/book is about, what would you say?
How to find which is low or high voltage side of transformer : How to find out which is the low voltage and which is the high voltage side of a transformer without connecting it to supply mains?
Predict the number of subscriptions for a month : Predict the number of subscriptions for a month in which there were 905 hours of telemarketing.
Learn what influences guest purchase decisions : Learn what influences guest purchase decisions. Starting capital to run the business 125Kwhilst 50K for the reserve fund. Learn what guests believe you do well and not so well.
Describe how psychology : 1. Describe how psychology, social psychology sociology, and anthropology have contributed to the study of organizational behavior. 2. Define intellectual ability and demonstrate its relevance to organizational behavior.
Write a paper regarding military mental issues : Write a Paper regarding military mental issues. Needs to be 3-4 pages
Branch offices and dealerships across the country : One of the leading laptop manufacturers has estimated the following demand equation based on the data from its 50 branch offices and dealerships across the country: Q = + 10,000 - 60P + 300A + 50 c P - 100 C A +50 I

Reviews

Write a Review

Basic Statistics Questions & Answers

  Statistics-probability assignment

MATH1550H: Assignment:  Question:  A word is selected at random from the following poem of Persian poet and mathematician Omar Khayyam (1048-1131), translated by English poet Edward Fitzgerald (1808-1883). Find the expected value of the length of th..

  What is the least number

MATH1550H: Assignment:  Question:     what is the least number of applicants that should be interviewed so as to have at least 50% chance of finding one such secretary?

  Determine the value of k

MATH1550H: Assignment:  Question:     Experience shows that X, the number of customers entering a post office during any period of time t, is a random variable the probability mass function of which is of the form

  What is the probability

MATH1550H: Assignment:Questions: (Genetics) What is the probability that at most two of the offspring are aa?

  Binomial distributions

MATH1550H: Assignment:  Questions:  Let’s assume the department of Mathematics of Trent University has 11 faculty members. For i = 0; 1; 2; 3; find pi, the probability that i of them were born on Canada Day using the binomial distributions.

  Caselet on mcdonald’s vs. burger king - waiting time

Caselet on McDonald’s vs. Burger King - Waiting time

  Generate descriptive statistics

Generate descriptive statistics. Create a stem-and-leaf plot of the data and box plot of the data.

  Sampling variability and standard error

Problems on Sampling Variability and Standard Error and Confidence Intervals

  Estimate the population mean

Estimate the population mean

  Conduct a marketing experiment

Conduct a marketing experiment in which students are to taste one of two different brands of soft drink

  Find out the probability

Find out the probability

  Linear programming models

LINEAR PROGRAMMING MODELS

Free Assignment Quote

Assured A++ Grade

Get guaranteed satisfaction & time on delivery in every assignment order you paid with us! We ensure premium quality solution document along with free turntin report!

All rights reserved! Copyrights ©2019-2020 ExpertsMind IT Educational Pvt Ltd