Predict the crawling age of a particular baby

Assignment Help Basic Statistics
Reference no: EM137941

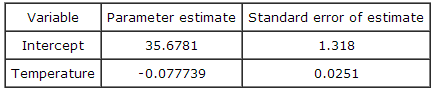
1: At what age do babies learn to crawl? Does it take longer to learn in the winter when babies are often bundled in clothes that restrict their movement? Data were collected at the University of Denver Infant Study Center, where parents and their babies participated in one of a number of experiments between 1988 and 1991. Parents reported the age (in weeks) at which their child was first able to creep or crawl a distance of four feet within one minute. The researchers also recorded the average outdoor temperature (in °F) six months after each baby's birthdate. For each month of the year, the researchers selected one baby, at random, born in that month. If we fit the least-squares line to the 12 data points (one for each month) we obtain the following results from a software package. Notice that temperature is taken as the explanatory variable and crawling age as the response.
s = 1.319

544_Estimate of the standard deviation.png


Suppose we wish to predict the crawling age of a particular baby when the average outdoor temperature is 25°F six months after birth. We use computer software to do the prediction and obtain the following output.

312_Estimate of the standard deviation1.png

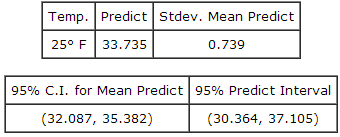
A. (32.087, 35.382).
B. (30.364, 37.105).
C. 33.735 ± 0.739.

2. At what age do babies learn to crawl? Does it take longer to learn in the winter when babies are often bundled in clothes that restrict their movement? Data were collected at the University of Denver Infant Study Center, where parents and their babies participated in one of a number of experiments between 1988 and 1991. Parents reported the age (in weeks) at which their child was first able to creep or crawl a distance of four feet within one minute. The researchers also recorded the average outdoor temperature (in °F) six months after each baby's birthdate. For each month of the year, the researchers selected one baby, at random, born in that month. If we fit the least-squares line to the 12 data points (one for each month) we obtain the following results from a software package. Notice that temperature is taken as the explanatory variable and crawling age as the response.

s = 1.319

544_Estimate of the standard deviation.png


The quantity s = 1.319 is an estimate of the standard deviation of the deviations in the simple linear regression model. Based on this information, the sum of squares for error, SSE, is

A. 1.319.
B. 1.740.
C. 17.398.

Reference no: EM137941

Questions Cloud

Results of the regression equation : Assess what the results of the regression equation tells managers and how it is likely to impact decisions made related to maximizing profitability.
Percentage effect which increase in output : The percentage effect which increase in output will have on the profit made from producing and selling commodity Alpha will be.
Star remains spherical during the entire process : a car with a mass 1865 kg is travelling west and slows down uniformly to 8.5 m/s over a distance of 108 m. calculate the initial speed of the car if the required braking force is 7525 N
Deadweight loss does great reception causes : How much deadweight loss does Great Reception causes when it restricts output and charges a price above marginal cost.
Predict the crawling age of a particular baby : Suppose we wish to predict the crawling age of a particular baby when the average outdoor temperature is 25°F six months after birth.
Firm operates conducive to abnormally high rates of return : Is the industry or industries in which the firm operates conducive to abnormally high rates of return.
What is the speed of the waves on this string : A child's toy consists of a piece of plastic attached to a spring. The spring is compressed against the floor a distance of 2.0 cm and released. If the spring constant is 85 N/m, what is the magnitude of spring force acting on the toy at the moment i..
Cross elasticity of demand for pipes and pipe tobacco : What is the cross elasticity of demand for pipes and pipe tobacco.
Length of an idealized closed tube : A person exerts a horizontal force of F = 175 N in the test apparatus shown in the drawing. (h = 0.25 m.) Find the horizontal force M that his flexor muscle exerts on his forearm.

Reviews

Write a Review

Basic Statistics Questions & Answers

  Simple random samples from the appropriate populations

Based on surveys conducted in 1989 and 1999, a researcher compared the proportion of high school age females interested in a career in science in 1989 with the proportion in 1999. He concluded that the proportions were not significantly different ..

  Determine the probabilities of events

What is the probability that they all hit the target?

  Smallest standard deviation to the statistic

Assuming the population is large, which sample size will give the smallest standard deviation to the statistic and select the numbers for the first five to be interviewed.

  The correct set of hypotheses

How many commercials' worth of data do I need to have a margin of error no more than 3, the correct set of hypotheses

  Uniform density curve

If a blue ball is selected you win nothing. Let X be the amount that you win. The expected value of X  and let the random variable X be a random number with the uniform density curve given below

  Evaluate the confidence interval

The 50 members of the placebo group had blood pressure lowered by an average of 15 points with standard deviation 8 points. To analyze this information we will use a, When testing whether or not the increases in spending are different, the test is ..

  Sampling variability

A simple random sample of 1000 Americans found that 61% were satisfied with the service provided by the dealer from which they bought their car.

  The standard error of the difference in sample means

Find the standard error of the difference in sample means,

  Find relatively higher cholesterol

A teacher gave a 25 question multiple choice test. After scoring the tests, she computed a mean and standard deviation of the scores. The standard deviation was 0. Based on this information

  What is the minimum score

A survey of college students collected information on several variables: Distance from Home, Age, Major, Gender, and Class. The variable Major is

  Statistical interpretation on junk food

Support colour-coding on packaged food to indicate healthier options

  Sampling variability and standard error

Problems on Sampling Variability and Standard Error and Confidence Intervals

Free Assignment Quote

Assured A++ Grade

Get guaranteed satisfaction & time on delivery in every assignment order you paid with us! We ensure premium quality solution document along with free turntin report!

All rights reserved! Copyrights ©2019-2020 ExpertsMind IT Educational Pvt Ltd