Plots the needle at a random position on the floor

Assignment Help MATLAB Programming
Reference no: EM132269131

Introduction to MATLAB Assignment -

You are required to submit two M-files that respond to the brief below. These files should be ready to be run in MATLAB to perform the tasks proposed in the brief.

You should not submit the numerical answers or the plots. Do not include any additional material apart from the two M-files because it will not be considered.

Problem 1 -

The integral of cos(x2) is called the Fresnel C integral. It is interesting to note that it does not have a closed-form solution. When it is evaluated from 0 to 1 it can be estimated using the Maclaurin infinite series as:

I = 01cos(x2)dx = n=0(-1)n/((2n)!(4n+1))

where (2n)! is the factorial of 2n.

You are asked to create a MATLAB M-file named "problem1_XXX.m" (exactly like this, without capital letters or spaces, and substituting XXX by your full student number) that

1. Calculates the series of I using as many terms as necessary to converge to the solution that will be considered as exact:

Iexact ∼ 0.904524237900272

Hint: the factorial of ?? (or ??!) in MATLAB is obtained by typing factorial(X). Type format long in the Command Window to display more than 4 decimals.

2. Creates a plot of cos(x2) in which the value of x appears in the abscissa and the value of the function appears in the ordinate. The plot should range from -10 to 10, with data points spaced 0.01 units. The curve should be black and solid.

3. Obtains the numerical integral of cos(x2) from 0 to 1 by adding the area of 30 rectangles equally spaced over the range from 0 to 1. Evaluate the function cos(x2) at the middle of each rectangle to calculate its height.

4. Obtains the error (in %) of the numerical integration with respect to the value of Iexact obtained from the Maclaurin infinite series. The value of this error should be displayed in the Command Window when running the script.

Problem 2 -

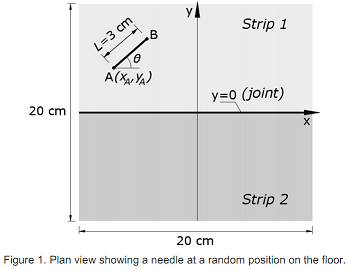
Consider a floor made of two parallel horizontal strips that are connected at y = 0. A straight needle of length L = 3 cm defined as a segment between the nodes A and B is dropped onto the floor and it stops at a random position given by the coordinates of its point A (xA, yA) and by its angle with respect to the horizontal line (θ), as shown in Figure 1.

1870_figure1.png

You are asked to create a MATLAB M-file named "problem2_XXX.m" (exactly like this, without capital letters or spaces, and substituting XXX by your full student number) that

1. Plots the needle at a random position on the floor considering that the point A of the needle can only be located in the square domain represented in Fig 1. This domain is a square of 20-cm centered at the origin of coordinates (x, y), as shown. The plot should be between -10 and 10 cm in the abscissas and in the ordinates. Use a solid black line to represent the needle and do not try to colour the background. Include a black horizontal line at y = 0. To represent the joint.

2. Uses a FOR loop to create a new plot with 50 needles distributed randomly on the floor. Use the same style and limits of the plot as in the previous section.

3. Counts how many of the 50 needles intersected (crossed) the joint of the floor in the previous plot and displays in the Command Window the proportion of the intersecting needles with respect to the total number of needles on the floor.

4. Creates a third plot that is the same as the second one but that represents the needles that intersect the joint in red colour and with a linewidth of 2 units, whilst the rest are plotted in black colour and with a linewidth of 1 unit. Use the same limits for the plot as in the previous sections.

Note: When running this file the three plots generated should appear in the screen. Hint: to avoid "losing" the first plot when the next one is generated you can use the command figure(). You are referred to the MATLAB Help for more information about how to use this command.

Note for curious minds: This is the Buffon's needle problem proposed by Georges-Louis Leclerc, Comte de Buffon, in the 18th century and it is the earliest problem in geometric probability that was solved. You can use your code to calculate the probability of a needle to lie across the line between the two strips of the floor (this is not part of the assessment). The solution of this probability is an approximation of the number π.

For your reference, the third figure in Problem 2 should look similar to Figure 2 (attached). Note that the position of the needles is random and because of this it is highly unlikely that you will obtain exactly the same plot as in Figure 2, it is just a reference.

IMPORTANT NOTE: in this problem all the plots should have the same aspect ratio between the horizontal and the vertical axes (as the one shown in Figure 2). This can be achieved by using the command: axis square.

Attachment:- Assignment File.rar

Reference no: EM132269131

Questions Cloud

Calculate the average access delay for a drive : Calculate the average access delay for a drive with HTH switching time of 3 ns, 6 R/W heads, TTT seek time of 4 mu
Type of membership based on amount of points : Is there any help available for a Python program with if-elif-else structure that can decide the type of membership based on the amount of points entered
What does the movie imply about american attitudes : An estimated 100,000 people lined the streets of Manhattan to pay their respects at Valentino's funeral. Suicides of despondent fans were reported.
Issues related to working in competitive global environment : Evaluate the legal, social and ethical issues related to working in a competitive global environment.
Plots the needle at a random position on the floor : EX1010 - Introduction to MATLAB Assignment, City University of London, UK. Plots the needle at a random position on the floor
Techniques that attackers use to exploit a computer : What information can be found about the techniques that attackers use to exploit a computer.
Difference between primary and secondary stakeholders : what is a stakeholder, and who area corporation's primary and secondary stakeholders? explain the difference between primary and secondary stakeholders.
Science of getting people to spend money on your product : We defined marketing as, “the art and science of getting people to spend their money on your product rather than the other guy’s, and be happy that they did so.
Analyze the values and world views concerning the eurasian : Analyze the values and world views concerning the Eurasian frontier represented in Vambery.

Reviews

len2269131

3/28/2019 11:51:01 PM

This is an individual coursework that is to be submitted in Moodle. You are required to submit two M-files that respond to the brief below. These files should be ready to be run in MATLAB to perform the tasks proposed in the brief. You should not submit the numerical answers or the plots. Do not include any additional material apart from the two M-files because it will not be considered. However, you should include succinct comments within the M-files to explain the different parts and built-in functions that you are using, always respecting the rules for commenting in MATLAB. Only Moodle submissions will be considered. This work should be entirely your own. Any potential plagiarism (copying) will be investigated thoroughly. If plagiarism is found it will be treated a serious academic misconduct.

len2269131

3/28/2019 11:50:54 PM

Marking criteria Problem 1: You will get full marks for Section 1 in this problem if you use a FOR loop that sums the series to match all the decimal numbers of the given solution with the minimum number of terms in the series. If more or less terms than strictly necessary are included in the series 5 marks will be deducted. Also, 5 marks will be deducted if the loop displays the terms or the sum of the series (this sum should be displayed after the loop is finished). 10 marks will be deducted if the first term of the sequence is not included in the series.

len2269131

3/28/2019 11:50:48 PM

You will get full marks for Section 2 if the plot is correctly visualised when running the file. 5 marks will be deducted if the style or the limits of the plot are not correct. You will get full marks for Section 3 if the numerical integration is conducted by means of a FOR loop that evaluates the height of each rectangle (in which the area under the curve is divided) exactly at the middle point of their width. 5 marks will be deducted if the function is not evaluated exactly at the center of the rectangles. 5 marks will be deducted if the number of rectangles considered in the integrations is different from 30. You will get full marks for Section 4 if the error of the numerical integration is correctly displayed in the Command Window (in %) when running the file. 5 marks will be deducted if the calculation of the error is correct but it is not displayed in the Command Window, or if it is not given as a percentage.

len2269131

3/28/2019 11:50:41 PM

No marks will be awarded if the calculation is incorrect. In addition, 10 marks will be deducted in Problem 1 if the file, as submitted, does not run correctly in MATLAB. Up to 10 marks will be deducted if the comments included to describe succinctly the different parts of the code and its functions are not appropriate, sufficient or if they are unnecessarily long: no comment line should exceed the width of the Editor view (marked with a vertical line). 5 marks will be deducted if the name of the file is not exactly “problem1_XXX.m”, where XXX should be substituted by your full student number. 5 marks will be deducted if the format in the file is poor (e.g. it includes unnecessary spacing between lines or inconsistent tabulations within the loop).

len2269131

3/28/2019 11:50:35 PM

Marking criteria Problem 2: You will get full marks for Section 1 in this problem if the plot and its style are correct. 5 marks will be deducted if the plot is correct but it is in a style different than the one indicated, or if the horizontal line at the joint is not included. No marks will be awarded if the length of the needle is not exactly 3 cm or if the Node A does is not in the limits of the plot (node B can be outside depending on the random numbers that define the position of A and the inclination of the needle).

len2269131

3/28/2019 11:50:29 PM

You will get full marks for Section 2 in this problem if the plot and its style are correct. 5 marks will be deducted if the plot is correct but it is in a style different than the one indicated, or if the horizontal line at the joint is not included. 10 marks will be deducted if the number of random needles in the plot is not exactly 50 or if they are not clearly located at random positions. You will get full marks for Section 3 in this problem if an IF statement is included within the loop to count how many needles intersect the joint (other options without the IF may be possible and if they are accurate and efficient they will be awarded full marks). 5 marks will be deducted if an unnecessarily large number of lines of code is used*. 5 marks will be deducted if the proportion of needles intersecting the joint is not displayed in the Command Window.

len2269131

3/28/2019 11:50:24 PM

You will get full marks for Section 4 in this problem if the plot and its style follow exactly the instructions given. 5 marks will be deducted if the plot is correct but it is in a style different than the one indicated, or if the horizontal line at the joint is not included. In addition, up to 10 marks will be deducted in Problem 2 if the comments included to describe succinctly the different parts of the code and its functions are not appropriate, sufficient or if they are unnecessarily long: no comment line should exceed the width of the Editor view (marked with a vertical line). 5 marks will be deducted if the name of the file is not “problem2_XXX.m”, where XXX should be substituted by your full student number. 5 marks will be deducted if the format in the file is poor (e.g. it includes unnecessary spacing between lines or inconsistent tabulations within the loop). 5 marks will be deducted if the three plots do not appear simultaneously on the screen when running the script.

Write a Review

MATLAB Programming Questions & Answers

  Recognition of colour

MATLAB for recognition of colour randomly using webcam realtime for RGB without external trigger in GUI.

  Design a three band stop filters

Design a three band stop filters for echo/reverberation cancellation for a specific room. Provide measurements of the room impulse response and frequency response with the coefficients.

  Design an appropriate controller to ensure the steady state

NHE2487 Control Systems - University of Huddersfield - Draw the block diagram and derive the transfer function of the closed loop liquid level control system

  Table of hurricane categories and associated wind speeds

Review the following table of Hurricane categories and associated wind speeds (miles per hour) and storm surge levels (feet above normal).

  Write program that computes the amount of income tax

EECS 1570 - Introduction to Computing for Psychology Assignment Questions, Lassonde School of Engineering, Canada. Write program that computes income tax

  Write a matlab script that solves ode

Write a matlab script that solves ODE: y' = 4/(1+x^2) using forward Euler's, improved Euler, classical Runge-Kutta, and Adams-Bashforth methods.

  Develop mathematical models for each propeller set

Develop mathematical models for each propeller set to relate the control voltage uc and va, vb and vc (and/or ia, ib, ic) of the field coil, uc and motor shaft speeds (ω1, ω2), and then tic and the drag force fx

  Determine the level of absolute approximate relative error

2006ENG Numerical and Data Analysis. Convert the equation into f(T) = 0 when cp of 1.1kJ/kgK. In our MATLAB program, develop a plot of f(T) versus a range of T = 0 to 1200 K. MATLAB. On the axes, put proper labelling.

  Determine the size for variables used in matlab program

If b=3, a=6 how many loops would the given program do? what will be the out put for z(4)? what would be size (in rows and columns) for variables z, i and b?

  Create a script that creates a random vector

Create a function called "hollowSphere" that calculates the volume using the formula shown in Problem I. Then write a script that prompts the user for the value of the inner radius and outer radius, your script will then call the function that you..

  Time domain design and analysis

To design a "custom" controller to reduce the vibrations of the seat and a PID controller to reduce the vibration of the seat

  Develop a program that solves the power flow

Develop a program that solves the power flow using the Gauss-Seidel or Newton-Raphson Method

Free Assignment Quote

Assured A++ Grade

Get guaranteed satisfaction & time on delivery in every assignment order you paid with us! We ensure premium quality solution document along with free turntin report!

All rights reserved! Copyrights ©2019-2020 ExpertsMind IT Educational Pvt Ltd