Plot the means of the treatments that used humor

Assignment Help Basic Statistics
Reference no: EM131747089

Question: Describing the effects. Refer to Exercise. The P-values for all main effect and two-factor interactions are significant at the 0.05 level. Using the table, find the marginal means (that is, the mean for the no-humor treatment, the mean for the no-humor and unfavorable process treatment combination, etc.) and use them to describe these effects.

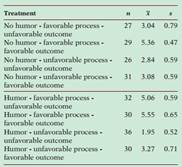
Exercise: The effect of humor. In advertising, humor is often used to overcome sales resistance and stimulate customer purchase behavior. A recent experiment looked at the use of humor as an approach to offset negative feelings often associated with Web site encounters.10 The setting of the experiment was an online travel agency, and they used a three-factor design, each factor with two levels. The factors were humor (used, not used), process (favorable, unfavorable), and outcome (favorable, unfavorable). For the humor condition, cartoons and jokes of the day about skiing were used on the site. For the no-humor condition, standard pictures of ski sites were used. Two hundred and forty-one business students from a large Dutch university participated in the experiment. Each was randomly assigned to one of the eight treatment conditions. The students were asked to book a skiing holiday and then rate their perceived enjoyment and satisfaction with the process. All responses were measured on a seven-point scale. A summary of the results for satisfaction follows:

406_5.png

(a) Plot the means of the four no-humor treatments. Do you think there is an interaction? If yes, describe the interaction in terms of the process and outcome factors.

(b) Plot the means of the four treatments that used humor. Do you think there is an interaction? If yes, describe the interaction in terms of the process and outcome factors.

(c) The three-factor interaction can be assessed by looking at the two interaction plots created in parts (a) and (b). If the relationship between process and outcome is different across the two humor conditions, there is evidence of an interaction among all three factors. Do you think there is a three-factor interaction? Explain your answer.

Reference no: EM131747089

Questions Cloud

Discuss the causes and effects of alienation in two readings : The sudden awareness of one's status as an outsider can be debilitating. Discuss the causes and effects of alienation in 2 readings.
Define the are within immediate control : How does the court define the are within (a suspect’s) immediate control?
Describe the distribution of each explanatory variable : Using numerical and graphical summaries, describe the distribution of each explanatory variable. Are there any unusual observations that should be monitored
Taxes and forestland usage : Taxes and forestland usage. A study was designed to assess the impact of taxes on forestland usage in part of the Upper Wabash River Watershed in Indiana.
Plot the means of the treatments that used humor : The effect of humor. In advertising, humor is often used to overcome sales resistance and stimulate customer purchase behavior. A recent experiment looked.
Explain how the definition of food is a social construct : Explain how the definition of food is a social construct? Why would most cultures eat Cheetos and not a cockroach?
Ringtones for cell phones : You decide to change the ringtones for your cell phone by choosing 2 from a list of the 10 most popular ringtones.17 Here is the list:
Explain the shape of all the three power functions : MA20226 - Explain the shape of all the three power functions - How does the power of the test based on T compare to the one defined by S
Describe the distribution of the response variable : Predicting movie revenue: simple linear regressions. Using numerical and graphical summaries, describe the distribution of the response variable, USRevenue

Reviews

Write a Review

Basic Statistics Questions & Answers

  Draw a boxplot of the height variable

Use the pennstate1 dataset on the companion website for this exercise. Draw a histogram of the height variable.

  Urn 1 contains 5 red 4 white and 6 blue marbles urn 2

1. urn 1 contains 5 red 4 white and 6 blue marbles. urn 2 contains 12 red 2 white and 3 blue marbles. one urn is chosen

  Formulate the null hypothesis and the alternative hypothesis

Formulate the null hypothesis and the alternative hypothesis.

  Explaining results by using scientifically recognized form

Write up your results by using scientifically recognized form.

  What is the value of zstat

In a random sample of 400 items, 88 are defective. If the null hypothesis is that 20% of the items in the population are defective, what is the value of ZSTAT?

  Confidence interval-sample size on polls data

Many newspapers, when reporting results of political polls, say that 'with 95% confidence, the results are in error by no more than ±3 percentage points'.

  T-critical value and standard error of the sample mean

The sample mean is 50, the t-critical value is 1.96, and the standard error of the sample mean is 2.

  The annual income was 58700 with a standard deviation of

a nursing school wants to estimate the true mean annual income of its alumni. it randomly samples 120 of its alumni.

  A tennis player makes a serve 72 percent of the time

a tennis player makes a serve 72 percent of the time. suppose the player gets 80 serves in a match.what is the mean and

  Determine the truth value - hitler ran the third reich

Write the following compound statements in symbolic form, then use your knowledge of the historical events referred to by the simple statements to determine the truth value of the compound statements.- It is not the case that Hitler ran the Third ..

  Name the distribution of a lightbulbs lifeand specify the

we know that the average life of a light bulb is 10000 hours.there are 12 lightbulbs in a classroom. in order for a

  Strong correlation mean

Explain why a strong correlation would be found between weekly sales of firewood and weekly sales of cough drops over a 1-year period. Does the strong correlation mean that one variable causes the other?

Free Assignment Quote

Assured A++ Grade

Get guaranteed satisfaction & time on delivery in every assignment order you paid with us! We ensure premium quality solution document along with free turntin report!

All rights reserved! Copyrights ©2019-2020 ExpertsMind IT Educational Pvt Ltd