Plot the diffraction pattern for the powder analyzed

Assignment Help MATLAB Programming
Reference no: EM133311670

Show all reasoning behind your answers.

Question 1: Excel spreadsheets are provided with experimental XRD data

i) Plot the diffraction pattern for the powder analyzed in the laboratory (intensity vs 2-theta). Label the peaks with their Miller indices, hkl, determined, below.

ii) Show that the powder is polycrystalline sodium chloride (NaCl), a = 5.620 Å, space group Fm- 3m. You should make a table showing the experimental 2-theta values, together with the calculated d-spacings and 2-theta values. Explain why there are systematic absences in the diffraction pattern. (Show all equations and working)

iii) Explain why the peaks at high 2-theta angle appear as doublets in the raw data.

iv) If the crystals in the powder were long, thin needles how could this affect the diffraction peaks?

v) The XRD data from the aluminium oxide nano powder is provided. Using the Scherrer equation, estimate the crystallite size. Use the peak at ~60o 2-theta (assume a single peak). Use 0.11o for the instrumental line broadening.

Question 2: (a) Explain, using Abbe's theory of image formation, the importance of the objective lens.

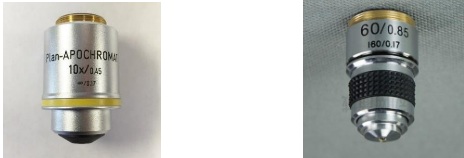
(b) Below, is an expensive ‘apochromatic' objective lens which corrects almost completely for all aberrations (left) and a cheaper lens (right).
i) With suitable sketches, explain two aberrations corrected in the apochromatic objective lens.
ii) Estimate the lateral resolution of both lenses.
iii) Estimate the depth of field of both lenses.
iv) What is the meaning of the 0.17, 160 and ∞ symbols written on the lens?

2120_Objective lens.jpg


(c) (i) Describe the theory behind the contrast technique of dark field microscopy.
(ii) How is this technique achieved for transmitted light microscopy?

(d) (i) How may a microscope be modified to achieve polarized light contrast?
(ii) Which materials, with examples, are suitable for examination with polarized light microscopy?

Question 3: (a) Describe, with the aid of a diagram, the design of the Scanning Electron Microscope (SEM).

(b) Give an estimate of the best lateral resolution for a modern transmission electron microscope, explaining why this is significantly better than a visible light microscope.

(c) Explain the technique of back-scattered electron imaging within the SEM. Describe and explain in detail the information these images can provide including any necessary specimen preparation.

(d) How can quantitative elemental information be obtained using an electron microscope using EDX?

(e) A ceramic material needs to be prepared for examination with the TEM.
(i) What is final diameter of the specimen?
(ii) What is a suitable final specimen thickness?
(iii) Explain a suitable method for preparing the thin specimen.

Question 4: (a) What information can be gained from the DSC thermal analysis technique?

(b) Referring to the three TGA lab videos on Minerva (Learning Resources/ Thermal analysis):
i) Describe the preparation of specimens prior to running the TGA.
iii) Explain the set up of the TGA instrument.
iii)Describe the presentation and interpretation of the output data.

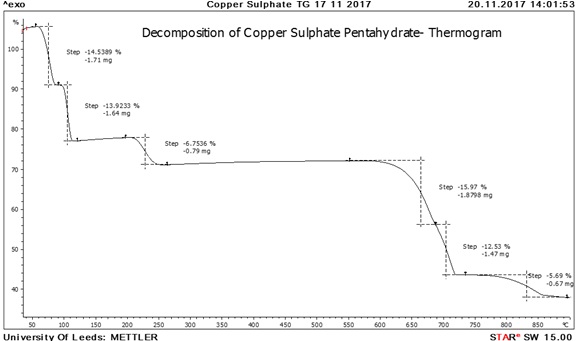
(c) With reference to the TGA trace, below, what information does it give about the transitions occurring in the specimen during heating?

2218_Objective lens1.jpg


Question 5: (a) What information can be gained about a material using Fourier transform infra-red spectroscopy?

(b) Describe the principles behind this technique i.e. what causes absorbances in the infra-red spectrum?

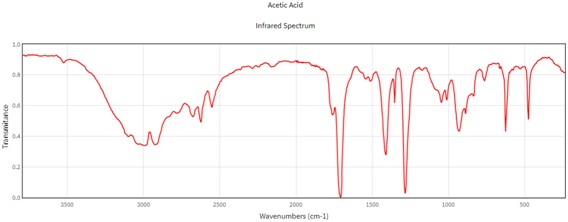
(c) Explain, in general, how to interpret an infra-red spectrum. Interpret the infra-red spectrum from ethanoic acid (acetic acid), below.

1481_Objective lens2.jpg

Attachment:- Thermal analysis technique.rar

Reference no: EM133311670

Questions Cloud

Provide an overview to your ceo on that factors : Your organization is considering building a factory that manufactures semiconductors. Provide an overview to your CEO on that factors that must be considered
What are the three levels of shared value : What are the three levels of Shared Value and how can each level be rolled out within your organization to develop or strengthen a sustainable competitive
What is the status of the memorandum and articles : What is the status ofthe memorandum and articles of association of XPL since the Companies {Amendment} Act 14 became operative?
Draw demand and supply curve of money market : Draw a demand and supply curve of money market and explain why the long run interest rate is not affected by the Fed's action in changing interest rate
Plot the diffraction pattern for the powder analyzed : Plot the diffraction pattern for the powder analyzed in the laboratory (intensity vs 2-theta). Label the peaks with their Miller indices, hkl, determined
Excessive money supply-usually called printing money : Why does excessive money supply, usually called printing money, accelerate inflation? Give an example.
List possible quality issues for travel agency : List 10 possible quality issues. Mention how you quantitatively measure these issues. make suggestions for quality improvements related to each issue.
Choose a firm that has not yet expanded internationally : Choose a firm that has not yet expanded internationally. Choose a market for the firm to enter. Determine which mode of entry is the right one for the firm
Explains use of government policy to control economy : Start with a brief introduction that explains use of Government policy to control the economy.

Reviews

Write a Review

MATLAB Programming Questions & Answers

  MATLAB Program - Sum of squares of first N natural numbers

In the given problem, sum of squares of first N natural numbers is to be computed till the SUM does not exceed 1000. This can be written in MATLAB

  Non-linear interpolation using polyfit function

Illustrate results of your interpolation by plotting a small piece of data before and after interpolation on the same graph using the "plot" and "hold on" commands. Submit the script and the plot in a single Word file.

  ER1630 Engineering Applications Assignment

ER1630 Engineering Applications Assignment Help and Solution, Computational Mathematics for Engineers Assessment help - University of Central Lancashire

  Which degree do you think best represents the data

Write a Matlab script to try fitting a 1st, 2nd, and 3rd degree polynomial to the dataset described by volume of water vs. volume of ice. Use subplot to draw all three

  Measure the output voltage at duty cycle

Measure the output voltage at duty cycle 0.1, 0.2, 0.3, 0.4, 0.5, 0.6, 0.7 and plot the characteristic curve. No need to record the oscilloscope waveform

  Image decimation using matlab

Find the system impulse response - Suppose the above transfer function is a filter, what type of filter is it? (a low-pass, high- pass, band-pass, band-stop or

  Set up a quadratic optimization problem

Set up a quadratic optimization problem that will determine the best investment mix and solve the problem using the MATLAB quadratic optimization routine quadprog. Interpret your results.

  Plot BER vs SNR curves for both BPSK and QPSK

BE201 Digital Communications Assignment- Simulation of a Communication System using MatLab, Melbourne Institute of Technology, Australia. Plot BER vs SNR curves

  Write an application to read a wav file

Write an application to read a wav file into an array and introduce a delay. Reduce the gain of the delayed sample and feed it back into the input

  Find the probability

Find the probability that more than 25 requests are received in the one minute interval by applying the central limit theorem. (Hint: apply the de Moivre-Laplace approximation)

  The function should compute and return

Define a function that takes as input parameters a function handle f, start and end values a and b, and a number of steps n. The function should compute and return the x and y values of the maximum of the function over the range a to b.

  Implement a system that analyses an audio file

Implement a system that analyses an audio file (.wav format) and visually shows how the energy at each frequency changes with time

Free Assignment Quote

Assured A++ Grade

Get guaranteed satisfaction & time on delivery in every assignment order you paid with us! We ensure premium quality solution document along with free turntin report!

All rights reserved! Copyrights ©2019-2020 ExpertsMind IT Educational Pvt Ltd