Reference no: EM132676210
This homework concentrates on regression and Bayesian Modelling.
1. Linear regression
The data set liareg.mat on the Blackboard site contains data vectors x and t. The data were generated according to
tn = w0 + w1xn + ∈n
where ∈n is Gaussian-distributed noise: ∈n~ N(0, σ2). Use linear regression to identify the coefficients ub and ul. Recall that to do this you need to set up a design matrix X that contains the features and the dummy feature I to go with the bias coefficient w0; thus

With X on hand. von can find the coefficients from:
w = Xtt
where t is the vector of the targets and Xt is the pseudo-inverse of X. Use piny in MATLAB or construct it yourself as Xt = (XTX)-1XT see the lecture slides.
The detailed requirements of this exercise are described as follows:
(a) Plot the data and the regression line. Measure the correlation between the features and targets. How does it relate to the coefficients?
(b) Estitnate the variance of the noise by finding the variance of the differences between your prediction of the targets and the actual targets. Thus if yn = w0 + w1xn is the prediction of the n-th target, then you could estimate the variance at as:
σ2 = 1/N ∑n=1N (tn - yn)2
Does your estimate of the variance make sense in terms of the average deviation of the targets from the prediction? Why?
2. Robust linear regression
Standard regression analysis minimises the squared error between the regression line and the data. namely:
E2(w) = ∑n=1N(tn - yn)(x:w))2
where yn(w) = w0 + w1xn and w = (w0, w1). Recall that the sum of squares error function E2 comes from the negative log likelihood and the assumption that the errors are normally distributed. A heavy-tailed distribution that is more appropriate if there are occasional large deviations from the systematic trend is the Laplacian distribution:
p(∈n) = p(tn|xn, w) ∝ exp {-|∈n|/σ}.
The detailed requirements of this exercise are described as follows:
(a) Substitute this expression for p(tn|xn, w) into the general expression for an error function E(w) = - ∑n=1N(tn log P(tn |xn, w) to show that the error function that arises from this noise distribution is
E1(w) = ∑n=1N|tn - yn(x;w)|
(b) In the data set lizIregioutlier °mat on the Blackboard site, the data vector z is the same as t except that one element is an outlier. Plot zn versus xn and find the linear regression line for these data using E2. Notice how the regression line is affected by the single outlier.
(c) Write a AIATLAB routine to fit a find a straight fitting the data by minimising E1(w). Note that the pseudo-inverse will not work here. One possibility is to find the minimum error by trying a grid of combinations of tn) and tel. From your plot of the data you should be able to estimate appropriate ranges of en3 (the intercept) and tel (the gradient) to search. If you adopt this approach it would be nice to plot a contour or imsgesc representation of El(w) as a function of ina and tut. The above searching-grid method works well when there are just two coefficients to be found. but is computation-ally very expensive when there are many. An alternative is to use a numerical minimiser such as the NIATIAB subroutine froissearch.m to locate the minimum you might start the search at the solution to the E2 problem.
(d) Plot the linear regression line for these data using E1. Compare your fitted line with the line derived from the squared error (all on the same graph). Discuss how the regression lines are grossly affected by the single outlier.
3. The support vector regression (SVR) with the e-sensitive loss (∈ > 0) is given by
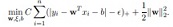
Derive the dual problem of the above formulation. and explain how to extend it to the nonlinear (kernelized) case.
4. LASSO (least absolute shrinkage and selection operator) is a regression analysis method which is given by method which is give by
(a) Explain the LASS (1) as an MAP solution in the Bayesian learning.
(b) Prove that LASSO (1) is equivalent to
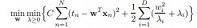
(c) Prove that the objective function (2) is jointly convex with respect to (w, λ).
Attachment:- MTL_hw.zip