Reference no: EM133280407
Learning Outcome 1: An understanding of the significance of continuous-time and discrete-time signal and system representations and sampling theory.
Learning Outcome 2: Analyze systems described by differential equations, difference equations or transfer functions using Laplace transform or Z-transform.
Learning Outcome 3: Perform signal manipulation in time and frequency domains.
Learning Outcome 1: Identify linear time-invariant (LTI) systems.
Learning Outcome 3: Perform signal manipulation in time and frequency domains.
Learning Outcome 3: Obtain response of LTI systems using convolution.
Learning Outcome 4: Determine frequency response of LTI systems using Fourier analysis.
Part A: Circuit Analysis using Laplace Transform
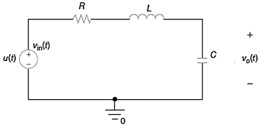
V= 15 Dc
R=1.5 mH
C= 0.017 mF

figure 1. RLC Circuit
The input signal (x(t)) is expressed as v_in (t)=u(t) volts (where u(t)is a unit step function) and the output signal (y(t)) is the output voltage, v_o (t), measured across the capacitor.
The circuit is treated as a system. Assume that all initial conditions to be zero (i.ei(0)=0 A and v_0 (0)=0 V).
Values of R, L and C are assigned separately for each individual group.
Provide all MATLAB codes and screenshots in your project report.
Question 1. Implement the given circuit in Multisim software and plot v_o (t) as a function of time. Discuss your observations.
Question 2. Set up a Kirchhoff Voltage Law equation for the given circuit and find an expression for V_o (s) in the s-domain (Hint: analyze the circuit in the s-domain using impedances of each element. Recall that ZL=sL and ZC=1/(sC)). Note that V_o (s) is a Laplace transform of v_o (t).
Question 3. Find the transfer function H(s)for this given circuit.
Question 4. Based on your result ofA.1 and A.3, use MATLAB to:
a. Plot the magnitude and phase of H(s) (|H(s)| and ?(H(s)) as a function of frequency from 50 Hz to 100 kHz.
b. Use built-in MATLAB function to find poles and zeros of H(s). Explain whether the system is a stable LTI system or not.
Question 5: Analytically and by using MATLAB,find the time-domain impulse responseh(t) and voltage across capacitor, v_o (t). Plot v_o (t) as a function of time and compare the plot to the resultof A.1.
Part B: Image processing in MATLAB
The following instructions require the use of several MATLAB built-in functions. Make sure to explain the operation of each of these functions and how they helped you perform the required tasks.
Given the attached image files, perform the following tasks:
Question 1. Add the pixels of image1 to image2 in order to create a new image. To do so, write MATLAB code that does not utilize built-in functions for the addition of images. (hint: "for" loops)
Question 2. Use the MATLAB command conv2() to convolve image3 with itself. What is this process referred to as? Show the result.
Question 3. Get the Fourier transform of image3 using the fft2() command.
If the result does not seem to be interesting, center the spectrum of the result using the fftshift() command. Does the result still look the same? Explain why.
Question 4. Based on your result in B.3. use the reverse processes ifftshift() and ifft2() to restore the image to its original form.
Attachment:- Circuit Analysis.rar