Reference no: EM132986484
Optimization
This assignment focuses on the estimation of the average amount of SMS messages per day that were sent by person A, and the change of this average amount. These data are also in the file num sms 30352746.txt. Figure 2.1 shows the evolution of the amount of SMS messages sent by this person during a period of 120 days. At one point during these 120 days this person broke up with his girlfriend. The question is whether or not this breaking up of the relationship had an influence on the amount of SMS messages this person sent per day. We will use Particle Swarm Optimization (PSO) for this purpose. PSO is a pre-programmed package in matlab (particleswarm) or python (pso) that looks for a set of parameters that minimize a specific function. For example, consider the function:
y = 2x2 - 24x + 48
We can easily calculate the first derivative, which is:
dy/dx = 4x - 24
Equalizing this to zero shows that the function will have its minimum for x equal to 6. PSO will thus return 6 for the optimal value of x, and -24 as the optimal function value (entering x=6 in Equation 2.1). The advantages of PSO is that it can return the optimal parameter and function values for situations in which 1) there is no analytical expression for the function, and 2) there are multiple independent variables (thus y depends on x1, x2, ...).
The amount of SMS messages sent per day can be assumed to follow a Poisson distribution with parameter λ. For this problem, there are three items that we don't know: the day of the break-up (let's call this n), the amount of messages sent before the break-up (we can call this λ1), and the amount of message sent after the break-up (this we will call λ2). We will solve this problem as follows:
1. We need to set upper and lower boundaries for n, λ1, and λ2. For n we can set these as 0 and 120 (the amount of days), respectively. For λ1 and λ2 we can set these as 0 and the highest amount of SMS messages per day in the time series, respectively.
Number of SMS Messages per Day
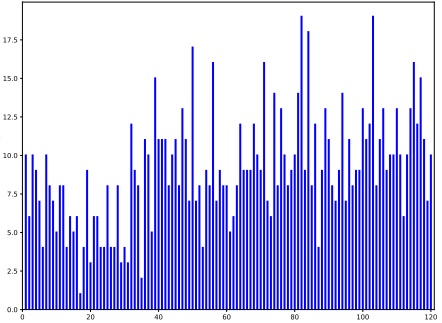
Figure 2.1: Number of SMS messages sent by person A per day.
2. We need to simulate the amount of messages per day. We can use the function numpy.random.poisson in python, or poissonrnd in matlab for this purpose. These functions will return a random number that follows the Poisson distribution with parameter λ (both functions need this pa- rameter as input). Thus we need to do:
- For the first n days, we generate a random number that follows a Poisson distribution with parameter λ1.
- Then, for 120- n days, we generate a random number that follows a Poisson distribution with parameter λ2.
- For the 120 days, we calculate the Root Mean Square Error:
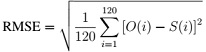
O(i) and S(i) are the observed and simulated amount of SMS messages per day, re- spectively. This is a function that you need to code in matlab or python.
3. PSO will then perform a large number of simulations using the function in step 2, and return the values of n, λ1, and λ2, as well as the lowest RMSE.
4. Since PSO works stochastically, it will return different parameter and objective function (the RMSE) values every time you apply it. It is thus best to repeat the PSO search 20 times, and retain the results of the search with the lowest RMSE value.
Your report must be written in MS Word or any other word processor, and contain:
- A short explanation (maximum 1000 words) on how your code works.
- The resulting values of the RMSE, n, λ1, and λ2.
Attachment:- Optimization.rar