Reference no: EM133025666
Part I Brief Responses
Question 1. In a small randomized clinical trial, after running a simple linear regression model containing treatment (Y/N) as the sole predictor variable, what is the main determinant of whether or not a potential confounder should be added to the model?___
a) It increases the R2 by more than 5%.
b) It is a statistically significant predictor of the outcome.
c) It changes the beta coefficient estimate of the predictor of interest by more than 5%.
Question 2. When variables determined not to be true confounders are removed from a multiple linear regression model, what happens to the R2? Explain using a single sentence.
Question 3. In cardiovascular antiplatelet trials an important pharmacodynamic endpoint is "mean percent platelet inhibition." What would be an appropriate statistical procedure for comparing "mean percent platelet inhibition" between 2 trial arms (new drug + standard of care vs. standard of care)? Explain using a single sentence.
Question 4. What is the effect of randomization on effect modification in a clinical trial?
Question 5. State the type of ANOVA that would be used to analyze data from a trial in which each drug was supplied from 3 different laboratories.
Question 6. A clinical trial was run comparing Drug B-10 mg + standard of care, Drug B-20 mg + standard of care, and standard of care alone in reducing diastolic blood pressure (DBP). The investigators considered age (continuous) and gender (categorical) to be potential confounders and gender to be a potential effect modifier of the treatment effect on DBP reduction. Write the appropriate full regression model to analyze the trial data.
Part II Brief Calculations
Question 1. In a clinical trial, survivorship on Drug A was found to follow an exponential distribution. If the median survival time was 8 months, calculate the hazard rate.
S(t) = e-λt
Question 2. In the per protocol population of a therapeutic equivalence trial the mean percent reduction in acne lesions at Week 12 vs. baseline was 53.27 for the test preparation (n=147) and 55.16 for the RLD preparation (n=153). The standard error of the difference in means was 5.526. Using method 2 for continuous outcomes, determine if therapeutic equivalence was achieved.
90% Classical CI:
Equivalence LCL:
Equivalence UCL:
Decision?
Part III Problems
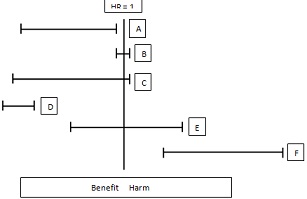
Question 1. Clinical trial results, expressed as 95% confidence intervals for the primary endpoint, are shown in the diagram below. For A-F, list the number for each description that applies as follows:
A: 1, 2, 3, 4, ...
B: 1, 2, 3, 4, ... and so on.
1. Reject Ho
2. Imprecision
3. Accept Ho
4. Clear absence of clinical benefit
5. Stoppage for futility if observed during interim analysis
6. Good result for generic trial
7. Likely type II error
8. Clear clinical benefit
9. Stoppage for superiority if observed during interim analysis
10. Clear evidence of clinical harm
11. Cannot distinguish between benefit and harm
12. Stoppage for safety if observed during interim analysis
A:
B:
C:
D:
E:
F:
Question 2. In a clinical trial the following results were observed:
Overall
New Drug + Standard of Care Standard of Care
Events 77 132
Person-months 2822 2692
ID1 = ID0 =
RR =
Males
New Drug + Standard of Care Standard of Care
Events 41 102
Person-months 1017 1694
ID1 = ID0 =
RR =
Females
New Drug + Standard of Care Standard of Care
Events 36 30
Person-months 1805 998
ID1 = ID0 =
RR =
Based on your calculations, what is the correct conclusion?___
A) Confounding only
B) Effect modification only
C) Confounding and effectmodification
D) No confounding and no effect modification
Question 3. Choose the correct response: increases or decreases
• As the minimum detectable difference between 2 means increases, the power ___..
• As the variance decreases, the power ___.
• For a fixed sample size, as the α-level decreases, power ___.
• As the number of groups tested in an ANOVA increases, the power ___.
• As the sample size decreases, the power ___.
• For a fixed sample size, as the type II error increases, power ___.
• For a fixed sample size, as the number of variables in a regression decreases, the power ___.
• For a fixed sample size, as the sample size per group diverges from equality, the power ___.
• For a fixed sample size, in a Mantel-Haenszel analysis, as the number of strata increases, the power ___.
• For a fixed sample size, as interaction terms are added to a regression model, the power ___.
Question 4. We are interested in evaluating the effectiveness of a new cream to treat psoriasis in a target population of subjects with 2-4 lesions having a severity score ranging from 4-8 on a 0-12 scale.
A random sample of 10 subjectsmeeting all inclusion/exclusion criteria was drawnfrom the target population. The study physician designated one lesion on each study subject as the "treatment lesion." He/she then measured the selected lesion's baseline severity score, instructed the subject to apply the cream once per day for 56 days to the designated lesion, and return for post-treatment evaluation on day 57.
Due to the limited range of the differences it was determined that these differences did not come from a normally distributed population of differences.
The data were as follows:
|
Subject
|
1
|
2
|
3
|
4
|
5
|
6
|
7
|
8
|
9
|
10
|
|
Baseline severity score
|
4
|
6
|
7
|
7
|
6
|
5
|
8
|
7
|
5
|
4
|
|
Post-treatment severity score
|
3
|
3
|
3
|
8
|
3
|
7
|
5
|
4
|
4
|
3
|
|
Difference
|
1
|
3
|
4
|
-1
|
3
|
-2
|
3
|
3
|
1
|
1
|
|
Sorted absolute difference
|
1
|
1
|
1
|
1
|
2
|
3
|
3
|
3
|
3
|
4
|
|
Rank
|
2.5
|
2.5
|
2.5
|
2.5
|
5
|
7.5
|
7.5
|
7.5
|
7.5
|
10
|
|
Signed rank
|
2.5
|
-2.5
|
2.5
|
2.5
|
-5
|
7.5
|
7.5
|
7.5
|
7.5
|
10
|
Using α = 0.05 (2-tailed), perform the Wilcoxon paired-sample test.
a) State the null and alternative hypotheses.
b) State the values critical value.
c) State the values of T+ and T-.
d) What is your decision?
e) What is the P-value range?
Question 5. We want to compare the mean reduction in diastolic blood pressure (DBP) over a 1-month treatment period between Drug B (new antihypertensive agent) and Drug A (standard of care) in a target population of mildly hypertensive (DBP range: 100-120 mm Hg) males aged 40-59 in City X.
Select a random sample of 10 subjects from the target population who meet all inclusion/exclusion criteria and randomize 5 subjects to receive Drug A and 5 to receive Drug B (n1 = 5, n2 = 5).
DBP reductions in mm Hg:
Drug A (0): 2,4,3,1,3
Drug B (1): 5,5,9,4,3
Perform a 2-sample t-test using the accompanying Blackboard downloaded SAS file (test2.sas).
a) State the critical value?
b) State the null and alternative hypotheses.
c) What are the values for the mean and standard deviation for Drugs A and B?
Mean(A) = SD(A) =
Mean(B) = SD(B) =
d) Comparing the ratio of the Drug A and Drug B means to that of the Drug A and Drug B standard deviations, what transformation should be applied to the data?
e) Rerun the analysis using the accompanying Blackboard downloaded SAS file (ltest2.sas).
f) Using the transformed data, what is your decision based on the P-value?
Question 6. A 5-month clinical trial was undertaken to determine if Regimen B (new drug + standard regimen) was superior to Regimen A (standard regimen) in maintaining survival in subjects with pancreatic cancer (PC). Ten (10) subjects meeting all inclusion/exclusion criteria were randomized to receive either Regimen A (n0= 5) or Regimen B (n1= 5). All subjects started follow-up at t=0 months.
The results for Regimen A:
Subject 1 died of PC at 2 months (person-months = ___ )
Subject 2 survived to end of trial (person-months = ___ )
Subject 3 died of PC at 1 month (person-months = ___ )
Subject 4 died of PC at 1 month (person-months = ___ )
Subject 5 died of PC at 2 months (person-months = ___ )
Number of events = ___, Number of person months = ___
The results for Regimen B:
Subject 1 survived to end of trial (person-months = ___ )
Subject 2 survived to end of trial (person-months = ___ )
Subject 3 died of PC at 4 months (person-months = ___ )
Subject 4 survived to end of trial (person-months = ___ )
Subject 5 died of MI at 3 months (person-months = ___ )
Number of events = ___, Number of person months = ___
Calculate the sample RR, uncorrected chi-square statistic, and 95% test-based CI.
ID1 =
ID0 =
RR =
X2=
X=
95% CI =
Question 7. In an 18-month oncology trial, 24 subjects with small cell lung carcinoma (SCLC) were divided into 2 groups; the experimental group contained 12 subjects randomized to Drug A + standard of care (SOC) and the control group contained 12 subjects randomized to SOC only.The recruitment period was from t=0 months to t=6 months, the minimum follow-up time was 6 months, and the maximum follow-up time was 12 months
The follow-up data for the SOC only group were as follows (in months): Person-months*
Subject 1 entered at t=3, died of SCLC at t=9 ___
Subject 2 entered at t=0, completed follow-up ___
Subject 3 entered at t=2, died of SCLC at t=13 ___
Subject 4 entered at t=2, died of SCLC at t=8 ___
Subject 5 entered at t=0, died of SCLC at t=10 ___
Subject 6 entered at t=6, died of MI at t=11 ___
Subject 7 entered at t=5, discontinued Drug A at t=7, and died of SCLC at t=14 ___
Subject 8 entered at t=1, withdrew consent after t=3 ___
Subject 9 entered at t=0, died of a hemorrhagic stroke at t=8 ___
Subject 10 entered at t=6, completed follow-up ___
Subject 11 entered at t=4, died of SCLC at t=14 ___
Subject 12 entered at t=3, died of SCLC at t=10 ___
* Note censoring with a "+" following any entered person-months value.
Perform a Kaplan-Meier analysis using the accompanying Blackboard downloaded SAS file (km.sas).
In the SAS program, between the CARDS and PPOC LIFETEST lines, enter the data for each subject as:
survival censor
where:
survival = person-months calculated above
and censor = 0 (if subject is censored) or 1 (if subject developed SCLC)
a) From the SAS output, fill in the following table:
|
Survival (months)
|
Censor
|
Survival [S(t)]
|
|
0.0000
|
|
|
|
2.0000
|
+
|
|
|
5.0000
|
+
|
|
|
6.0000
|
|
|
|
6.0000
|
|
|
|
7.0000
|
|
|
|
8.0000
|
+
|
|
|
9.0000
|
|
|
|
10.0000
|
|
|
|
10.0000
|
|
|
|
11.0000
|
|
|
|
12.0000
|
+
|
|
|
12.0000
|
+
|
|
b) What is the estimated median survival time?
Question 8. A clinical trial was undertaken comparing 2 doses of Drug B (10 mg and 20 mg) and Drug A (standard of care)in reducing systolic blood pressure (SBP) in a population of female subjects aged 50 - 69 yr in City X with moderate systolic hypertension (SBP: 130 - 150 mm Hg).
A random sample of 21 subjects from the target population meeting all inclusion/exclusion criteria was randomized to receive either Drug A, Drug B-10 mg, or Drug B-20 mg (n1 = 7, n2 = 7, n3 = 7).
The data were analyzed using analysis of covariance (ANCOVA) because age was considered a potential confounder.
Using the regression results below:
sbp = α + β1age + β2drugb10 + β3drugb20 + β4age*drugb10 + β5age*drugb20
|
Source
|
Sum of Squares
|
Degrees of Freedom
|
Mean Square
|
|
Total
|
530.666667
|
20
|
|
|
Regression
|
492.551974
|
5
|
98.5103948
|
|
Error
|
38.1146925
|
15
|
2.5409795
|
sbp = α + β1age + β2drugb10 + β3drugb20
|
Source
|
Sum of Squares
|
Degrees of Freedom
|
Mean Square
|
|
Total
|
530.666667
|
20
|
|
|
Regression
|
489.930809
|
3
|
163.31027
|
|
Error
|
40.7358574
|
17
|
2.39622
|
sbp = α + β1age
|
Source
|
Sum of Squares
|
Degrees of Freedom
|
Mean Square
|
|
Total
|
530.666667
|
20
|
|
|
Regression
|
320.412526
|
1
|
320.412526
|
|
Error
|
210.254141
|
19
|
11.066007
|
1) Determine if ANCOVA is appropriate using the F mean-square drop test.
2) If ANCOVA is appropriate, use the F mean-square drop test to determine if the ANCOVA is significant.
3) If the ANCOVA is significant, perform Dunnett's test and calculate 95% confidence intervals.
If Dunnett's test is performed:
|
Drug
|
Least Square Mean
|
Standard Error vs. A
|
Critical Value (q') vs. A
|
|
A
|
13.35
|
|
|
|
B-10
|
13.23
|
0.830
|
|
|
B-20
|
19.41
|
0.855
|
|
Attachment:- Biostat Questions.rar