Percentages of economically disadvantaged students

Assignment Help Basic Statistics
Reference no: EM131816771

Percentages of economically disadvantaged students are listed for 17 middle schools and 12 high schools in a certain school district around the year 2000.

709_Percentages of economically disadvantaged students.png

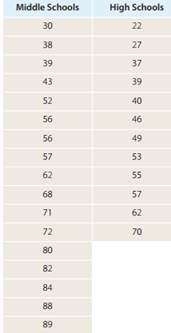
a. Are the data values formatted with a column for values of quantitative responses and a column for values of a categorical explanatory variable, or are they formatted with two columns of quantitative responses (one for each of two categorical groups)?

b. Find the five-number summary values for middle schools.

c. Find the five-number summary values for high schools.

d. Neither type of school has outlier values. Construct a side-by-side boxplot to display percentages of disadvantaged students in the two types of schools.

e. Are the centers comparable? If not, which type of school tends to have higher percentages of economically disadvantaged students?

f. Suppose students are classified as being economically disadvantaged based on a form that must be completed by parents regarding household income, and sent in to make students eligible for free or reduced school lunches. Explain how this could bring about a difference in reported percentages for the two types of schools.

g. Disadvantaged students might tend to drop out before they have completed high school. Explain how this could bring about a difference in reported percentages for the two types of schools.

h. Are the spreads comparable? If not, which type of school tends to have more variable percentages of economically disadvantaged students?

i. The shapes of the two distributions are similar: Are they markedly leftskewed, fairly symmetric, or markedly right-skewed?

j. Considering the shapes of the distributions, do mean and standard deviation do a good job of summarizing centers and spreads?

Reference no: EM131816771

Questions Cloud

Explain why he must have used a reporting application : Given what you know from this chapter and from the nature of the FlexTime problem, explain why he must have used a reporting application.
Explain key flu indicator and their prevalence in your state : You are the head of a nine-member public health committee at the state public health department. Explain Key flu indicators and their prevalence in your state.
What would be the maximum purchase price acceptable : What would be the maximum purchase price acceptable to the Minnetonka Corporation for the bindings? Support your answer with an appropriate explanation.
Which group of students originally knew the correct answer : Did the truth change? Should these students retroactively be given credit? Which group of students originally knew the correct answer?
Percentages of economically disadvantaged students : Percentages of economically disadvantaged students are listed for 17 middle schools and 12 high schools in a certain school district around the year 2000.
What is the maximum price levoy would accept for sensors : Assume that if Levoy outsourced, it would create sufficient excess capacity such that it would retain the supervisor and have him oversee production.
Describe an enterprise information system : Using your answer to question 2, describe an enterprise information system that will eliminate the silos.
Standard deviations for earnings : Suppose someone claims that students in higher years at school tend to earn more money, because they are older and have more work experience.
Determining-will the company be better off or worse off : A supervisor would have to be hired and paid a salary of $30,000 to oversee production of the casings. The rent charge is based on the space utilized.

Reviews

Write a Review

Basic Statistics Questions & Answers

  In a test of hypotheses a researcher used the level of

in a test of hypotheses a researcher used the level of significance a .05. based on a random sample she obtained a

  Marketing and consumer behavior - state the null hypothesis

State the null and alternative hypotheses in terms of p.- Describe type I and type II errors in this context.- For a fixed sample size.

  What is the probability that this system of three lines

A communications network has a built-in safeguard system against failures. In this system if line I fails, it is bypassed and line II is used. If line II also fails, it is bypassed and line III is used. The probability of failure of any one of the..

  Designate explanatory variable and the response variable

In each case, designate the explanatory variable and the response variable.- Explain whether each of the following experiments was single-blind, double-blind, or neither.

  Confidence interval for the true average number of months

Compute a 99% confidence interval for the true average number of months taken by bankruptcy petitioners to acquire debts listed on their petitions.

  Information on significant difference

In order to test to see if there is any significant difference in the mean number of units produced per week by each of three production methods, the following data were collected:

  Probability that none of vehicles requires warranty service

a) What is the probability that none of these vehicles requires warranty service? Use the Binomial equation for P(X=0).

  The dealer spins the wheel and at the same time rolls a

a roulette wheel has 38 slots numbered 0 00 and 1 to 36. the slots 0 and 00 are colored green 18 of the others are red

  A joint probability distribution for the pair of random

Previously, it was shown that if X and Y are independent random variables, then τ (8.2) has a value of 0. Show that the converse is not true by constructing a joint probability distribution for the pair of random variables X and Y such that τ = 0 ..

  Why right-hand side range of constraint has no upper limit

List the constraint(s) that are not binding and interpret their slack/surplus variable(s). What does it mean that the right-hand side range of constraint 2 has no upper limit?

  Assisting the county assessor

Suppose you are assisting the county assessor (whose job is to assess the value of properties for property tax purposes) in determining a model where the price of a single-family residential property in a given neighborhood can be predicted based on ..

  Internal and external pricing factors

You are under great pressure to raise tuition to compensate for the falling revenues. However, you suspect that raising tuition might only make matters worse. What internal and external pricing factors should you consider before you make your deci..

Free Assignment Quote

Assured A++ Grade

Get guaranteed satisfaction & time on delivery in every assignment order you paid with us! We ensure premium quality solution document along with free turntin report!

All rights reserved! Copyrights ©2019-2020 ExpertsMind IT Educational Pvt Ltd