Reference no: EM132597421
Operational Amplifiers - Filters
Learning Outcome 1. Review and contrast actual characteristics of an operational amplifier with the ideal.
Learning Outcome 2. Interpret manufacturers' data to match operational amplifier parameters to a given performance and application.
Learning Outcome 3. Analyse the performance of operational amplifier circuits in terms of gain, phase, stability and pulse response.
Learning Outcome 4. Design, simulate, build and test operational amplifier circuits.
Learning Outcome 5. Apply mathematical skills in more complex contexts involving operational amplifiers.
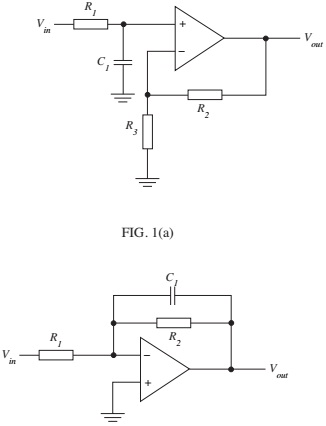
Question 1. Derive the transfer function Vout/Vin for each of the filter circuits given in FIGURE 1 and sketch Bode plots for each circuit (amplitude and phase).
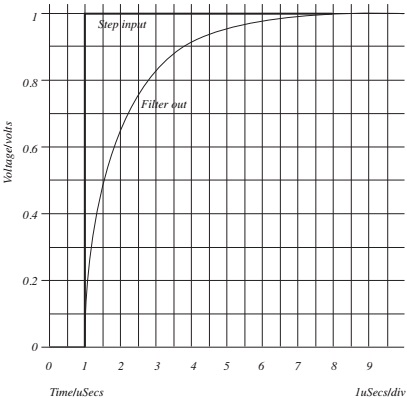
Question 2. (a) FIGURE 2 shows the response of a first-order filter to a step input. Estimate the half-power cut-off frequency of the filter and sketch its frequency and phase response.
(b) Select (with justification) from the op-amps listed in TABLE A those which are NOT suitable for use as the active component in the filter of (a) above.
|
Op-amp
|
GBW (MHz)
|
SR (V/ms)
|
V10(mV)
|
FPBW (kHz)
|
|
TLC071
|
10
|
16
|
1.5
|
1000
|
|
TLV2721
|
0.51
|
0.18
|
0.6
|
11
|
|
TLC2201A
|
1.8
|
2.5
|
0.6
|
159
|
|
TLV2771A
|
4.8
|
9
|
1.9
|
572
|
TABLE A
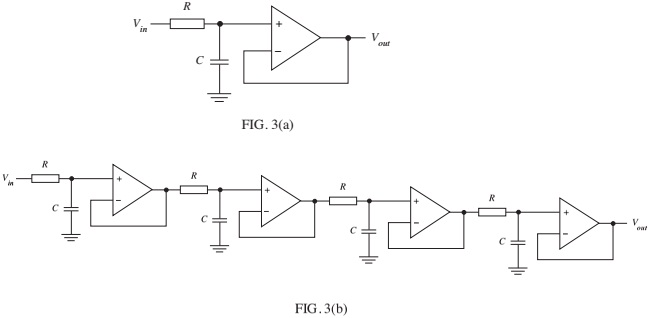
Question 3. FIGURE 3(a) shows a simple low-pass filter followed by a buffer amplifier.
(a) Write down the transfer function for the filter.
(b) Determine the 3db frequency (fc) if R = 10 kΩ and C = 10 nF.
(c) If four such stages are cascaded as shown in FIGURE 3(b), determine the gain and phase of the overall transfer function at
(i) 0.1fc
(ii) 10fc.
Question 4. Design and PSPICE model a bandpass filter of ‘Sallen and Key' topology and having the following characteristics: your design by means of a Bode plot.
fo ≈ 3.3 kHz, Q ≈ 2.2.
Verify
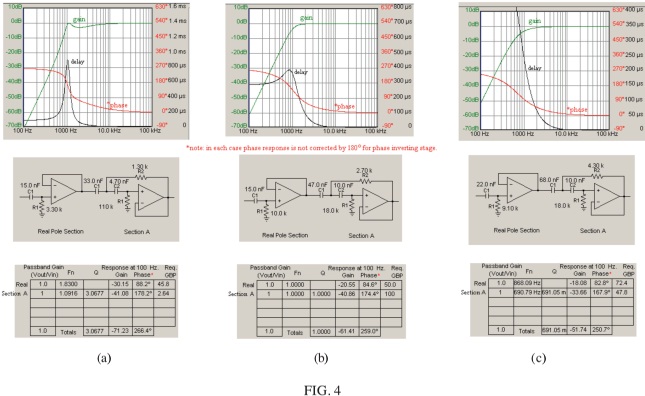
Question 5. The filters of FIGURE 4(a) to (c) where designed using a commercial software package.
Write a report (of approximately 750 words) that discusses and compares the design of each filter in terms of their performance, circuit topology, application and any other relevant characteristics. You may for example attempt to relate the choice of component values to the filters performance.