Reference no: EM132339802 , Length: 2
The experiment:
Participants (1-20) completed 4 tests (X,Y,Z,A) for each test they were given a raw mark. These first need to be converted to percentages (each score in X,Y,Z,A times by 100 to convert it into percentages). The passage (E, B, C, D) represents the type of passage that was given to the participant.
ID = participant number
Score 1 = score on test 1
Score 2 = score on test 2
Score 3 = score on test 3
Score 4 = score on test 4
Score 5 = score on test 5
Test
X = test 1
Y = test 2
Z = test 3
A = test 4
ANOVA need to be carried separately out on:
- Speed
- Score 1
- Score 2
- Score 3
- Score 4
With the test (X,Y,Z,A)
Significance value p<0.05
After ANOVA, Paired samples t-tests to be carried out on test (X, Y, Z. A) and Scores (score 1, score 2, score 3, score 4, score 5)
Graphs for each individual person something like this for each individual (using appropriate axis) labelling ‘p1' ‘p2' (representing participant 1, participant 2)
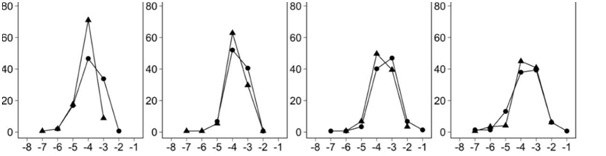
And a graph with everyone in it (a graph you feel that represents the data the best, not pie charts).
R SCRIPT: Must be commented throughout - showing a ‘*' for any significant results in the output (when p <0.05). Mauchley'sLevenes test must also be done for each ANOVA.
Attachment:- Data Sheet.rar