Nature of relationship between the two variables

Assignment Help Basic Statistics
Reference no: EM13653390

A survey was conducted among the residents of Pune City, its suburbs and the Pune Cantonment area. The following three pie diagrams show their respective preferences for living in City, Suburb and cantonment.
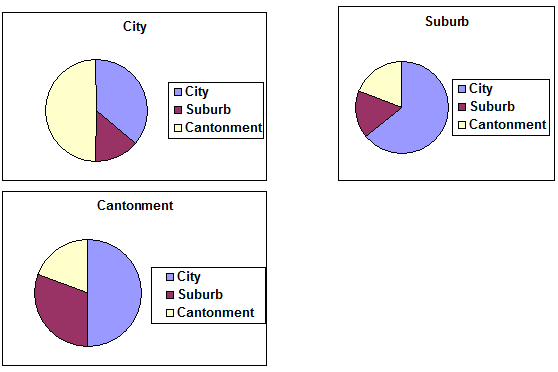
489_Prepare appropriate frequency distribution.png

Questions:
1. Do you see similar preference distribution in the three groups of residents?
2. Which residents are most happy about where they are actually living?
3. Which residents are the least happy about where they are actually living?

2. Description

Suppose you are doing market research for a company that sells automotive accessories. You are interested in the types of cars driven by customers of a particular mall. On one particular day, you count the following types of cars in the lot:

------------------------------------------------------------------------------------------------------

Family car                   Economy car               Economy car               Utility van

Family car                   Wagon                         Wagon                         Wagon

Sports car                    Economy car               Utility van                   Family car

Pickup truck                Utility van                   Sports car                    Utility van

Wagon                         Wagon                         Wagon                         Family car

Pickup truck                Utility van                   Sports car                    Utility van

Economy car               Economy car               Utility van                   Sports car

Utility van                   Sports car                   

-----------------------------------------------------------------------------------------------------

Questions:

1. Prepare appropriate frequency distribution

2. Represent above data by suitable graph

3. Description:

In a series of four one day cricket matches, Sachin and Sourav Scored as follows:

Sachin:            99                    116                  95                    110

Sourav:       110                       145*                40                      20

* : not out

Question: If you have to select the ‘Man of the Series' out of these two only whom will you select? Why?

4. Description

Following are the data on height of father (X) and height of son (Y)


X (in cms)

165

166

167

167

168

169

170

172

Y (in cms)

167

168

165

168

172

172

169

171


Questions

(a) Plot these data and comment on the nature of relationship between the two variables under consideration.

(b) Find correlation between (X, Y).

5. Using the data in Q. 4 above, find regression equation of height of son on father's height.

Reference no: EM13653390

Questions Cloud

What is probability that either of the company shows profit : What is the probability that either of the company shows profit - What is the probability the family has all children of the same sexes
Evaluate the satellites altitude above surface of earth : A satellite moves in a circular orbit around Earth at a speed of4567 m/s. Determine the satellite's altitude abovethe surface of Earth
A concave makeup mirror is designed : A concave makeup mirror is designed so that aperson 23 cm in front of it seesan upright image magnified by a factor of two. What is the radius of curvature of the mirror in meters?
Determine the capacitance of the device : The space between two concentric conducting spherical shells ofradii b = 1.70 cm and a =1.20 cm is filled with a substance of dielectric constant κ = 29.5. Determine the capacitance of the device
Nature of relationship between the two variables : Plot these data and comment on the nature of relationship between the two variables under consideration - find correlation between (X, Y).
The strategic implications of moving there versus not moving : 1. You are considering moving your assembly plant from the U.S. to Mexico. Your boss has asked you to provide a summary analysis of the relocation.
Determine force exerted by the horizontal rope on her arms : A 55.1 kg ice skater is moving at4.10 m/s when she grabs the loose end of a rope, the opposite end of which is tied to a pole. She thenmoves in a circle of radius 0.800 maround the pole.
What are the final velocities of the car and truck : An automobile of mass 1500 kg moving at 25.0 m/s collides with a truck of mass 4500 kg at rest. What are the final velocities of the car and truck
Prepare appropriate frequency distribution : Prepare appropriate frequency distribution, represent above data by suitable graph - Plot these data and comment on the nature of relationship between the two variables under consideration.

Reviews

Write a Review

Basic Statistics Questions & Answers

  Statistics-probability assignment

MATH1550H: Assignment:  Question:  A word is selected at random from the following poem of Persian poet and mathematician Omar Khayyam (1048-1131), translated by English poet Edward Fitzgerald (1808-1883). Find the expected value of the length of th..

  What is the least number

MATH1550H: Assignment:  Question:     what is the least number of applicants that should be interviewed so as to have at least 50% chance of finding one such secretary?

  Determine the value of k

MATH1550H: Assignment:  Question:     Experience shows that X, the number of customers entering a post office during any period of time t, is a random variable the probability mass function of which is of the form

  What is the probability

MATH1550H: Assignment:Questions: (Genetics) What is the probability that at most two of the offspring are aa?

  Binomial distributions

MATH1550H: Assignment:  Questions:  Let’s assume the department of Mathematics of Trent University has 11 faculty members. For i = 0; 1; 2; 3; find pi, the probability that i of them were born on Canada Day using the binomial distributions.

  Caselet on mcdonald’s vs. burger king - waiting time

Caselet on McDonald’s vs. Burger King - Waiting time

  Generate descriptive statistics

Generate descriptive statistics. Create a stem-and-leaf plot of the data and box plot of the data.

  Sampling variability and standard error

Problems on Sampling Variability and Standard Error and Confidence Intervals

  Estimate the population mean

Estimate the population mean

  Conduct a marketing experiment

Conduct a marketing experiment in which students are to taste one of two different brands of soft drink

  Find out the probability

Find out the probability

  Linear programming models

LINEAR PROGRAMMING MODELS

Free Assignment Quote

Assured A++ Grade

Get guaranteed satisfaction & time on delivery in every assignment order you paid with us! We ensure premium quality solution document along with free turntin report!

All rights reserved! Copyrights ©2019-2020 ExpertsMind IT Educational Pvt Ltd