Reference no: EM132451633
MSD 201 Statistical Methods Assignment - Computer Project, Rider University, USA
The computer project is to analyze the data stored in Retirement Funds, from case study at the end of chapter 15. The goal of our project is to use the data of 407 funds, and build a multiple regression model to predict the 3-year returns and to prepare a written report to present the results of your analysis. Your final report should be no more than eight pages in length. The report should begin with an executive summary of one to three paragraphs. This summary - which is the last item written - should identify the problem, indicate your approach to solving it, and concisely state your conclusion.
The body of your report should indicate how you developed your conclusion. Begin with a concise statement of the regression objective from the business perspective. Next, use your knowledge of the dependent variable and predictor variables to formulate a model. You may need to identify several possible models before finalizing a fitted model which best serves your objective. You may follow the procedure given below when you explore the data.
1. Download your data from StatCrunth of MyStatLab from Retirement Funds of chapter 15. Format your data to include following variables:
Dependent: y = 3 - year return
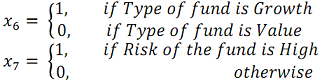
Independent:
x1 = Assets
x2 = Turnover Ratio
x3 = SD
x4 = Sharpe Ratio
x5 = Expense Ratio
Things to be included in the report
i) Print a sample of your data set, say the 1st 20 funds.
ii) Give a brief description of each of the above variables.
2. Begin your study with a graphical investigation of the nature of the relationship between the dependent variable and each of the quantitative predictor variables. You can use scatter-plots. Comment on the possible form of relationship (e.g., first-order or second-order) between the dependent variable and each quantitative predictor variable based on the graph.
Things to be included in the report
i) Print the Scatter-plots between the dependent variable and each of the quantitative predictor variables.
ii) Give a visual assessment about the possible 2nd order relationship.
3. The initial model to consider is a first-order model which includes all seven predictor variables. Use statistical techniques learned in this class to analyze the model. Things to be included in the report
i) Print the output of the regression analysis.
ii) Write the regression equation and perform some basic analysis with respect to its usefulness.
4. Next you may want to try models that include the second-order terms of the quantitative predictor variables without interaction. Include all seven independent variables and one second-order term at a time.
Things to be included in the report
i) Identify a list of quantitative predictor variables such that the second-order term is significant.
5. To investigate the effect of interaction, add a two-way interaction term (such as x1x2, x1x3, ... . x6x7), one at a time, between two predictor variables, to the model. Try all the possible two-way interaction terms among the seven predictor variables to see if any two-way interaction is significant. (Note: The total number of interaction models you should run is the Combination of 7 taken out 2, that is,
 = 21, models)
Things to be included in the report -
i) Identify a list of interaction terms that are significant and the reasons why.
6. Build your 1st multiple regression model by using all independent variables, all second-order terms identified in Step 4, and all interaction terms identified in step 5.
Things to be included in the report -
i) Print the output of the regression analysis.
ii) Write the regression equation and perform some basic analysis with respect to its usefulness.
7. Based on the analysis in Step 6, find the best regression model for predicting the 3-year return.
Things to be included in the report -
i) Print the output of the regression analysis.
ii) Write the regression equation and perform some basic analysis with respect to its usefulness.
8. Perform a thorough Residual Analysis on the model from Step 7 to verify the four regression assumptions.
Things to be included in the report -
i) Print all of residual analysis related plots.
ii) Comment on whether the model assumptions hold.
In your report, you do not need to include full details of all the regression work that you tried. But you should list things that were attempted. Your report should provide enough details to justify your final selection of the best model and to show the major steps that lead to your decision.