Reference no: EM132377900
CURTIN UNIVERSITY
SCHOOL OF PUBLIC HEALTH
EPID6002 Quantitative Methods MPH406
Assignment Case study application (CSA)
Case study application ONE
This case study application uses a sub-dataset of random sample (Weight 2019S2QM.dta) from a larger scale study. This dataset contains information of weight, exercise level and gender measured for 72 participants. This dataset provides one continuous variable Y (weight) and two categorical variables (exercise and gender) as follows in Table 1.
Table 1 Variables in Weight 2019S2QM.dta
|
Variable
|
Description
|
|
weight
|
Weight (kg)
|
|
exercise
|
Exercise index
1 = Low, 2 = High
|
|
gender
|
Gender 1 = Female, 2 = Male
|
The researcher who conducted the study would like to answer the following questions with your help.
1) If gender is an effect modifier on the association between exercise and weight? i.e., if gender modifies the effect of exercise on weight?
2) If mean weight loss due to different exercise levels is the same for males and females?
Use a significance level α of 5% for your tests and conclusions.
Hint:
• You may find helpful to follow the instructions in computing Lab Review of introductory biostatistics for t test.
• You may find helpful to follow the strategy for analyses given in computing Lab Interactions.
1. The researcher believes that investigating the relationship between weight and exercise, accounting for gender as a potential effect modifier would be able to answer the research questions. Do you agree?
Yes, I agree.
Which variable should be the dependent variable?____________________________
Which are independent variables? ________________________________________
Which variable is the possible effect modifier? ______________________________
No, I do not agree.
Then how do you analyse this data to answer the research question?
___________________________________________________________________
Which variable should be the dependent variable? ___________________________
Which are independent variables? _______________________________________
2. Firstly the researcher decided to ask your help for testing the null hypothesis that the population mean weight is the same regardless exercise levels, i.e., she would like to compare the population mean weight between the two exercise levels.
(No Stata output(s) are required for this question)
i) What are the hypotheses?
HO: __________________________________________________
HA: __________________________________________________
ii) Which t test you would recommend for testing the null hypothesis?
iii) Conclusion of the t test:
3. Having compared the population mean weight between the two exercise levels, the researcher would like to perform a multiple regression analysis for comparing the difference in the population mean weight between the two exercise levels, accounting for gender in the model as a potential effect modifier.
i. Which of the multiple regression models you learnt from our unit is appropriate for the research's analysis? Why?
ii. The researcher plotted the following mean plots to check whether there is an interactive effect.
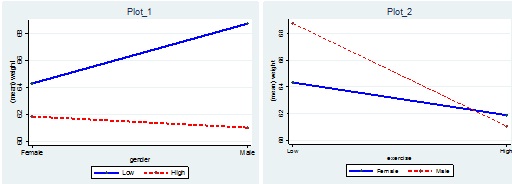
a) Which mean plot (Plot 1 or 2) indicates that gender probably modifies the effect of exercise on weight? Why? _______________________________________________________________________
_______________________________________________________________________
b) Based on the mean plot you chose, make a justification on whether the interaction term between exercise and gender should be included and assessed in the multiple regression model.
_______________________________________________________________________
_______________________________________________________________________
iii. Fit the multiple regression model you recommended (in Question 3.i) for the researcher.
Attach relevant Stata output (eg., ANOVA table) here
_______________________________________________________________________
iv. Based on the output of your regression model (Question 3.iii), test the hypothesis that there is no interaction in the population between the exercise and gender, and answer the question "if gender modifies the effect of exercise on weight?"
_______________________________________________________________________
_______________________________________________________________________
_______________________________________________________________________
v. The researcher believes that any variable with a p value >0.05 needs to be removed from the multiple regression model, and a further simplified model is necessary. Do you agree with her? Comment on "if a further model is necessary" by selecting an answer below (2 marks):
a) Yes I agree, the non-significant variable (list it here_______________) should be removed from the model and hence I can have a further simpler model. Briefly justify your answer.
Attach Stata output (eg., parameter estimation table) here
_______________________________________________________________________
_______________________________________________________________________
b) No, I disagree, there is no need to remove any variable from the model and hence no need to have a further model. Briefly justify your answer.
Attach Stata output (eg., parameter estimation table) here
_______________________________________________________________________
_______________________________________________________________________
4. Based on your final model obtained in Q3 v,
a. What is the prediction equation (estimated regression coefficients are rounded up to 3 decimal places)?
b. The researcher believes the constant in your final model has no any meaningful interpretation (1 mark).
I do not agree with the researcher. Then give your interpretation of the constant in the final model here
I do agree with the researcher. Then briefly explain your reasons here.
_______________________________________________________________________
_______________________________________________________________________
c. Calculate the predicted mean weight loss low and high exercise levels for each gender based on the regression equation obtained in Q4 a.
_______________________________________________________________________
_______________________________________________________________________
_______________________________________________________________________
_______________________________________________________________________
d. The researcher interpreted the regression coefficient ‘7.733' as ‘People who participated in low level exercises were heavier by 7.733 kg on average than those who participated in high level exercises regardless their gender'. Do you think this interpretation is correct? (2 marks)
Yes. I think this interpretation is correct because...
_______________________________________________________________________
_______________________________________________________________________
_______________________________________________________________________
No. I think this interpretation is incorrect because...
_______________________________________________________________________
_______________________________________________________________________
_______________________________________________________________________
5. Using information you obtained from the final model in Q4, write a detailed conclusion with supporting evidence to help the researcher answer the research questions (page 3).
Case study application TWO
A researcher would like to investigate the association between exposure to a special chemical and a specific type of cancer using a random sample (Cancer 2019S2QM.dta) from a practical study. He collected other variables such as number of cigarette smoked per day and living distances from the site of exposure, which will be accounted for as well in his analysis.
The main research question of this study is
1) "if exposure to a special chemical increases the risk of having the cancer?"
The other research questions are
2) "if living close to the site of exposure is associated with a higher risk of having the cancer?"
3) "if more number of cigarette smoked per day is associated with a higher risk of having the cancer?"
Furthermore, the researcher would like to predict the probability of having the cancer for individuals, who have different personal characteristics.
Use a 5% significance level for all statistical tests and conclusions. The information of the variables in the data set is given below in Table 2:
Table 2: Variable in Cancer 2019S2QM.dta
Hint:
i. You may find it helpful to follow the strategy for analyses given in computing lab Logistic Regression I &II.
1. Given this data, to answer the research questions, you need to help the research identify
1.1. Which variable is the dependent variable?
1.2. Which variable is the main independent variable of interest?
1.3. Which other variables should be controlled in your analysis?
1.4. Given the type of the dependent variable, which kind of regression analysis you should use, and Why?
_________________________________________________________________________
__________________________________________________________________________
__________________________________________________________________________
2. Literature shows number of cigarette smoked per day may confound the association between exposure to a special chemical and the risk of having the specific type of cancer. You need to help the researcher using the steps covered in lectures/labs to assess the possible confounding effect.
1.1 Find the crude odds ratio (also its 95% confidence interval (CI)) of having the Cancer comparing the individuals who exposed to the special chemical with the individuals who didn't.
Attach Stata output here
Crude odds ratio (related to Exposure): _____________________________
Corresponding 95% CI: ______________________________
1.2 Assess whether NumberCigarette confounds the effect of Exposure on the risk of having the Cancer. Assess this possible confounding effect by calculating the relevant statistic from both epidemiological and statistical perspectives. Attach Stata output here
Adjusted Odds Ratio (related to Exposure): ______________________________
P value for ‘NumberCigarette: _______________________________________
Assessment of confounding effect:
Conclusion:
__________________________________________________________________________
__________________________________________________________________________
3. Given that living distance from the site of exposure and exposure to the special chemical may have a combined or multiplicative effect on the risk of having the Cancer, the researcher would like to test whether there is an interactive effect between Distance (continuous) and Exposure on the risk of having the Cancer. Help the researcher answer the following questions with evidence from your analysis.
Attach Stata output here
a) Whether the effect of exposure to the special chemical is modified by the living distance from the site of exposure? You need to answer this question with evidence from your analysis.
__________________________________________________________________________
__________________________________________________________________________
__________________________________________________________________________
b) Whether you can have a simpler model by removing this interaction term? You need to answer this question with at least two reasons.
__________________________________________________________________________
__________________________________________________________________________
__________________________________________________________________________
4. The researcher wanted to predict the probability of having the cancer for some individuals with different personal characteristics. He would like to perform a multiple regression analysis you recommended in Q1, and include Exposure, NumberCigarette, and Distance (continuous) in his model without any interactions between the independent variables.
Attach Stata output (eg., parameter estimation table with Coefficients) here
4.1 What is the regression equation (coefficients are round up to 3 decimal places)? P is the probability of having the Cancer.
=______________________________________________________________
4.2 Now help the researcher calculate the predicted probability of having the cancer for an individual who
a) not expose to the special chemical, smoked 50 cigarettes a day and lived 12 km from the site of exposure? Make a brief comment
_________________________________________________________________________
__________________________________________________________________________
b) exposed to the special chemical, smoked 20 cigarettes a day and lived 0.1 km from the site of exposure? Make a brief comment
__________________________________________________________________________
__________________________________________________________________________
5. To help the researcher answer the research questions, you need to perform the multiple regression analysis you recommended in Q1, including Exposure, NumberCigarette, and Distance (continuous) in your model without any interactions between the independent variables.
Attach Stata output (eg., parameter estimation table with Odds Ratios) here
1) Whether exposure to a special chemical increases the risk of having the cancer? Answer this question by interpreting the information provided by the adjusted odds ratios (and 95% CI) related to Exposure.
2) Whether living close to the site of exposure is associated with a higher risk of having the cancer? Answer this question by interpreting the information given from the adjusted odds ratios (and 95% CI) related to Distance.
___________________________________________________________
___________________________________________________________
___________________________________________________________
___________________________________________________________
3) If more number of cigarette smoked per day is associated with a higher risk of having the cancer? Answer this question by interpreting the information obtained from the adjusted odds ratios (and 95% CI) related to NumberCigarette.
___________________________________________________________
___________________________________________________________
___________________________________________________________
___________________________________________________________
6. Given the categorized distance, the researcher would like to know from which living distance category, the risk of having the cancer will be significantly decreased. You need to perform another regression analysis including Exposure, NumberCigarette, and DistanceCat (categorical) in your model without any interactions between the independent variables.
Attach Stata outputs (eg., parameter estimation table with Odds Ratios) here
a) Do you think overall DistanceCat is a significant predictor of having the Cancer? Why?
___________________________________________________________
___________________________________________________________
___________________________________________________________
___________________________________________________________
b) From which living distance category, the risk of having the cancer will be significantly decreased? By how many %? How the population mean odds decreased with 95% certainty?
___________________________________________________________
___________________________________________________________
___________________________________________________________
___________________________________________________________
c) Compare the multivariable models with continuous Distance (Q5) and the model with the categorical DistanceCat (this question Q6), if you were the researcher, which model you would use to explain the association between the risk of cancer and living distances from the site of exposure. Justify your choice.
Case study application Three
This case study application uses information from a published paper "Survival of neonates and predictors of their mortality in Tigray region, Northern Ethiopia: prospective cohort study. H G Mengesha et al" BMC Pregnancy and Childbirth (2016) 202
1. Briefly describe the study to answer the following questions:
i. What were the study design and objectives?
ii. How were the participants recruited: where, when, how many?
iii. What are the main limitations (list two) of the study?
___________________________________________________________
___________________________________________________________
___________________________________________________________
___________________________________________________________
2. Read Methods section, answer the following questions:
1) How did the authors define the main outcome variable Neonatal Mortality (NM)? What is the event of interest, how did the authors calculate survival time (i.e., time-to-event), how did the authors define the censored neonates?
2) If you were the authors, complete the table below for the 10 neonates with different conditions, where Censoring status is coded "1" for event and "0" for censored.
3. Read Data Management and Analysis section and Table 6, answer the following questions:
i. Which statistical regression analysis with which regression strategy were used for Table 6? Which method the authors used for assessing the proportional-hazards assumption?
ii. How many (and list all) statistically significant factors associated with neonatal mortality obtained based on the multivariable Cox-proportional hazard model in Table 6? Why you know they are statistically significant?
iii. Choose ONE significant factor obtained based on the multivariable Cox-proportional hazard model from Table 6, interpret its effect and 95%CI on neonatal mortality using your own words.
RESEARCH ARTICLE - Survival of neonates and predictors of their mortality in Tigray region, Northern Ethiopia: prospective cohort study Hayelom Gebrekirstos Mengesha, Alem Desta Wuneh, Wondwossen Terefe Lerebo and Tesfay Hailu Tekle
Attachment:- Quantitative Methods.rar