Mpc for the proportional tax consumption schedule

Assignment Help Microeconomics
Reference no: EM13844913

1. Suppose that the aggregate demand and aggregate supply schedules for a hypothetical economy are as shown below:

Amount of Real GDP Demanded (Billions)

Price Level  (Price Index)

Amount of Real GDP Supplied (Billions)

$100

300

$450

200

250

400

300

200

200

500

100

100

a. Use the data above to graph the aggregate demand and aggregate supply curves.

Instructions:

1. Use the line tools "AD" and "AS" to draw the aggregate demand (plot 5 points total) and aggregate supply curves (plot 5 points total) given in the table above. To earn full credit for this graph, you must plot all required points for each curve.

2. Use the drop line tool called "Eq" to indicate the equilibrium price level and the equilibrium level of real output.

1522_1.png

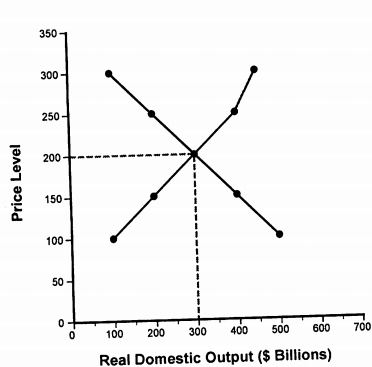
What is the equilibrium price level and the equilibrium level of real output in this hypothetical economy?

Equilibrium price level =......

 Equilibrium level of real output =......billion

Is the equilibrium real output also necessarily the full-employment real output? .....

b. If the price level in this economy is 150, will quantity demanded equal, exceed, or fall short of quantity supplied?

By what amount? ..........


if the price level is 250, will quantity demanded equal, exceed, or fall short of quantity supplied? .......

By what amount? ......... billion

c. Suppose that buyers desire to purchase $200 billion of extra real output at each price level.

What Is the new equilibrium price level and level of real output?

The new equilibrium price level =..........

 The new level of real output = ........... billion


Refer to the data in the table given below. Suppose that the present equilibrium price level and level of real GDP are 100 and $225. And that data set B represents the relevant aggregate supply schedule for the economy.

(A)

(B)

(C)

Price Level

Real GDP

Price Level

Real GDP

Price Level

Real GDP

110

275

100

200

110

225

100

250

100

225

100

225

95

225

100

250

95

225

90

200

100

175

90

225


a. What must be the current amount of real output demanded at the 100 price level?

 Real output demanded = ......

 b. If the amount of output demanded declines by $25 at the 100 price level shown In B. what will be the new equilibrium real GDP?

The new equilibrium level of real GDP =..........

In business cycle terminology, what would economists call this change in real GDP?


3. Refer to the table below

Real Output Demanded (Billions)

Price Level

Real Output Supplied (Billions)

$506

105

$513

508

104

512

510

100

510

512

96

507

514

92

502

What is the equilibrium level of output? ........ billion

What Is the equilibrium price level? $ ...............

3. Suppose that aggregate demand increases such that the amount of real output demanded rises by $7 billion at each price level. Add the new values for real output demanded to the table below.

Real Output Demanded (Billions)

New Real Output Demanded

Price Level

Real Output (Billions)

$506

513

108

513

508

515

104

512

510

517

100

510

512

519

96

507

514

521

92

502

What is the new equilibrium level of output? .......... billion

What Is the new equilibrium price level?..................

By what percentage will the price level increase?..........

4. Assume that, without taxes, the consumption schedule for an economy is shown in the first two columns of the table below. The MPC without taxes is 0.8.

Suppose a proportional tax with a 10 percent tax rate is imposed instead of the regressive tax. Calculate the new consumption schedule and note the MPC (tax inclusive) and the multiplier.

Instructions: Enter only whole numbers for your answers.

GDP, (Billions)

Consumption Before Tax (Billions)

Tax Rate

Disposable Income,( Billions)

Consumption $ After Tax, (Billions)

$100

$120

10%

90


200

200

10%

180


300

280

10%

270


400

360

10%

360


500

440

10%

450


600

520

10%

540


700

600

10%

630


Instructions: Round your answers to two decimal places.

MPC for the proportional tax consumption schedule = ........

The multiplier for the proportional tax consumption schedule...........

Reference no: EM13844913

Questions Cloud

Parameter weibull distribution : Let Y have a 3-parameter Weibull distribution, that is, Y has pdf and cdf in the following form with α > 0, γ > 0, θ > 0:
Improving mapreduce performance through data placement : Prepare a paper using IEEE report on Improving MapReduce Performance through Data Placement in Heterogeneous Hadoop Clusters
Analysis of the pros and cons of locating the facility : You have been asked to take the lead in identifying two possible locations for the facility in two different regions of the world and then prepare an analysis of the pros and cons of locating the facility in each of the two sites
Prepare the budgets for the fiscal year ending december : Prepare the following budgets for the fiscal year ending December 31, 2006 using the provided spreadsheets. Note: it is required to use the provided worksheets using Excel formulas.
Mpc for the proportional tax consumption schedule : MPC for the proportional tax consumption schedule
How biological personality theory influences : Prepare two slides on the following topic: Explain strengths of how biological personality theory influences interpersonal relationships
Most difficult type of cyber attack to defend against : Consider how this information could be used by an organization for its security program. Was anything surprising to you - Post a message to the forum regarding your experience with any of the cyber attacks described in the text.
Strengths and weaknesses of the set of directions : What visual and/or auditory cues were given to help the subject complete the tasks? What were the strengths and weaknesses of the set of directions that were given to the subject

Reviews

Write a Review

Microeconomics Questions & Answers

  The free rider problem

Question: Explain why the free rider problem makes it difficult for perfectly competitive markets to provide the Pareto efficient level of a public good.

  Failure of the super committee is good thing for economy

Some commentators have argued that the failure of the “Super committee” is good thing for the economy?  Do you agree?

  Case study analysis about optimum resource allocation

Case study analysis about optimum resource allocation: -  Why might you suspect (even without evidence) that the economy might not be able to produce all the schools and clinics the Ministers want? What constraints are there on an economy's productio..

  Fixed cost and vairiable cost

Questions:  :   Which of the following are likely to be fixed costs and which variable costs for a chocolate factory over the course of a month?  Explain your choice.

  Problem - total cost, average cost, marginal cost

Problem - Total Cost, Average Cost, Marginal Cost: -  Complete the following table of costs for a firm.  (Note: enter the figures in the  MC   column  between  outputs of  0 and 1, 1 and 2, 2 and 3, etc.)

  Oligopoly and demand curve problem

Problem based on Oligopoly and demand curve,  Draw and explain the demand curve facing each firm, and given this demand curve, does this mean that firms in the jeans industry do or do not compete against one another?

  Impact of external costs on resource allocation

Explain the impact of external costs and external benefits on resource allocation;  Why are public goods not produced in sufficient quantities by private markets?  Which of the following are examples of public goods (or services)? Delete the incorrec..

  Shifts in demand and movements along the demand curve

Describe the differences between shifts in demand and movements along the demand curve. What are the main factors which can shift the demand curve? Explain why they cause the demand curve to shift. Use examples and draw graphs to support your discuss..

  Article review question

Article Review Question: Read the following excerpts from the article "Fruit, veg costs surge' by Todd, Dagwell, published in the Herald on January 25th 2011 and answer questions below:

  Long-term growth, international trade & globalization

Long-term Growth, International Trade & Globalization:- This question deals with concepts such as long-term growth, international trade and globalization. Questions related to trade deficit, trade surplus, gains from trade, an international trade sce..

  European monetary union (emu) in crisis

"Does the economic bailout of Spain and Greece spell the beginning of the end for the European Monetary Union (EMU)?"

  Development game “settlers of catan”

Read the rules of the game, the overview and the almanac for the Development Game "Settlers of Catan"

Free Assignment Quote

Assured A++ Grade

Get guaranteed satisfaction & time on delivery in every assignment order you paid with us! We ensure premium quality solution document along with free turntin report!

All rights reserved! Copyrights ©2019-2020 ExpertsMind IT Educational Pvt Ltd